

191
3.1
Spatial Resolution and Zones
To allow the description of spatial dynamics for a
variety of species, population zones in ISIS-Fish
are based on the habitat structure identified by
Girardin (unpublished data) which consisted of
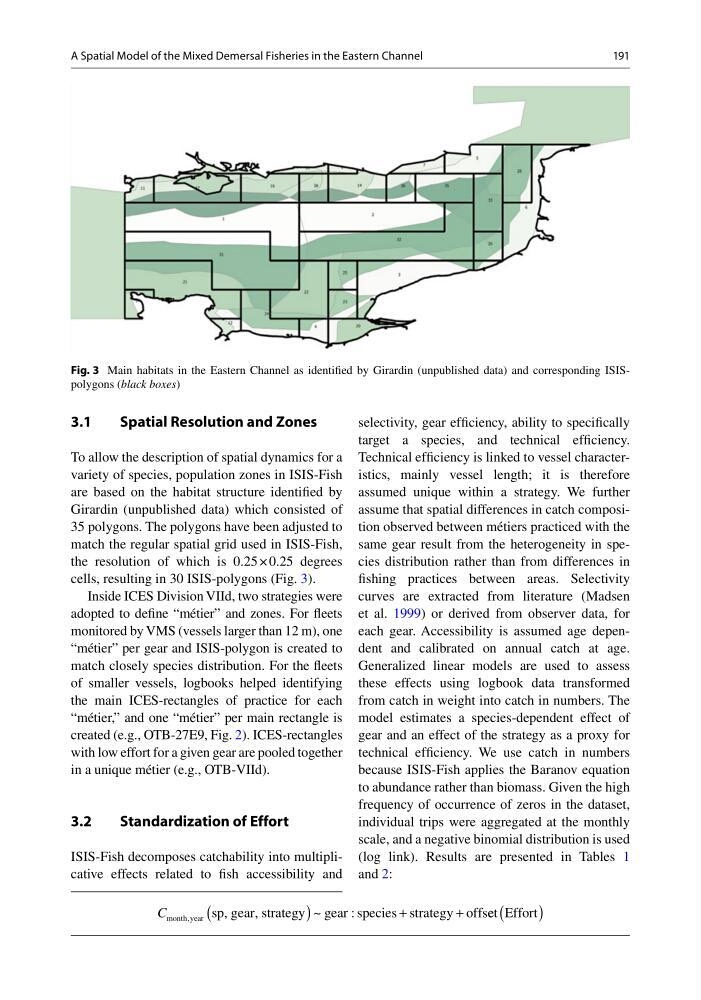
35 polygons. The polygons have been adjusted to
match the regular spatial grid used in ISIS-Fish,
the resolution of which is 0.25 × 0.25 degrees
cells, resulting in 30 ISIS-polygons (Fig. 3).
Inside ICES Division VIId, two strategies were
adopted to define “métier” and zones. For fleets
monitored by VMS (vessels larger than 12 m), one
“métier” per gear and ISIS-polygon is created to
match closely species distribution. For the fleets
of smaller vessels, logbooks helped identifying
the main ICES-rectangles of practice for each
“métier,” and one “métier” per main rectangle is
created (e.g., OTB-27E9, Fig. 2). ICES-rectangles
with low effort for a given gear are pooled together
in a unique métier (e.g., OTB-VIId).
3.2
Standardization of Effort
ISIS-Fish decomposes catchability into multiplicative effects related to fish accessibility and
selectivity, gear efficiency, ability to specifically
target a species, and technical efficiency.
Technical efficiency is linked to vessel characteristics, mainly vessel length; it is therefore
assumed unique within a strategy. We further
assume that spatial differences in catch composition observed between métiers practiced with the
same gear result from the heterogeneity in species distribution rather than from differences in
fishing practices between areas. Selectivity
curves are extracted from literature (Madsen
et al. 1999) or derived from observer data, for
each gear. Accessibility is assumed age dependent and calibrated on annual catch at age.
Generalized linear models are used to assess
these effects using logbook data transformed
from catch in weight into catch in numbers. The
model estimates a species-dependent effect of
gear and an effect of the strategy as a proxy for
technical efficiency. We use catch in numbers
because ISIS-Fish applies the Baranov equation
to abundance rather than biomass. Given the high
frequency of occurrence of zeros in the dataset,
individual trips were aggregated at the monthly
scale, and a negative binomial distribution is used
(log link). Results are presented in Tables 1
and 2:
C month year sp, gear, strategy gear species strategy offs
,
~
:
(
)
+
+
e et Effort
(
)
Fig. 3 Main habitats in the Eastern Channel as identified by Girardin (unpublished data) and corresponding ISISpolygons (black boxes)
A Spatial Model of the Mixed Demersal Fisheries in the Eastern Channel
3.1
Spatial Resolution and Zones
To allow the description of spatial dynamics for a
variety of species, population zones in ISIS-Fish
are based on the habitat structure identified by
Girardin (unpublished data) which consisted of
35 polygons. The polygons have been adjusted to
match the regular spatial grid used in ISIS-Fish,
the resolution of which is 0.25 × 0.25 degrees
cells, resulting in 30 ISIS-polygons (Fig. 3).
Inside ICES Division VIId, two strategies were
adopted to define “métier” and zones. For fleets
monitored by VMS (vessels larger than 12 m), one
“métier” per gear and ISIS-polygon is created to
match closely species distribution. For the fleets
of smaller vessels, logbooks helped identifying
the main ICES-rectangles of practice for each
“métier,” and one “métier” per main rectangle is
created (e.g., OTB-27E9, Fig. 2). ICES-rectangles
with low effort for a given gear are pooled together
in a unique métier (e.g., OTB-VIId).
3.2
Standardization of Effort
ISIS-Fish decomposes catchability into multiplicative effects related to fish accessibility and
selectivity, gear efficiency, ability to specifically
target a species, and technical efficiency.
Technical efficiency is linked to vessel characteristics, mainly vessel length; it is therefore
assumed unique within a strategy. We further
assume that spatial differences in catch composition observed between métiers practiced with the
same gear result from the heterogeneity in species distribution rather than from differences in
fishing practices between areas. Selectivity
curves are extracted from literature (Madsen
et al. 1999) or derived from observer data, for
each gear. Accessibility is assumed age dependent and calibrated on annual catch at age.
Generalized linear models are used to assess
these effects using logbook data transformed
from catch in weight into catch in numbers. The
model estimates a species-dependent effect of
gear and an effect of the strategy as a proxy for
technical efficiency. We use catch in numbers
because ISIS-Fish applies the Baranov equation
to abundance rather than biomass. Given the high
frequency of occurrence of zeros in the dataset,
individual trips were aggregated at the monthly
scale, and a negative binomial distribution is used
(log link). Results are presented in Tables 1
and 2:
C month year sp, gear, strategy gear species strategy offs
,
~
:
(
)
+
+
e et Effort
(
)
Fig. 3 Main habitats in the Eastern Channel as identified by Girardin (unpublished data) and corresponding ISISpolygons (black boxes)
A Spatial Model of the Mixed Demersal Fisheries in the Eastern Channel