

180
• Better account of population distributions
across life stages – with several feeding
grounds (three), nurseries (six), and reproduction (three) zones for each species (i.e.,
12 zones for both plaice and sole) – according to Rochette et al. (2012) and Carpentier
et al. (2009)
• Fishing activities updated according to Lehuta
et al. (2015)
The model was tested over 12 years under two
different scenarios: (1) one with only total allowable catches (TAC) as management measure
(forced by 2008–2011 actual TACs, then dynamically set by a harvest control rule that aims at
reaching F MSY in five years following ICES
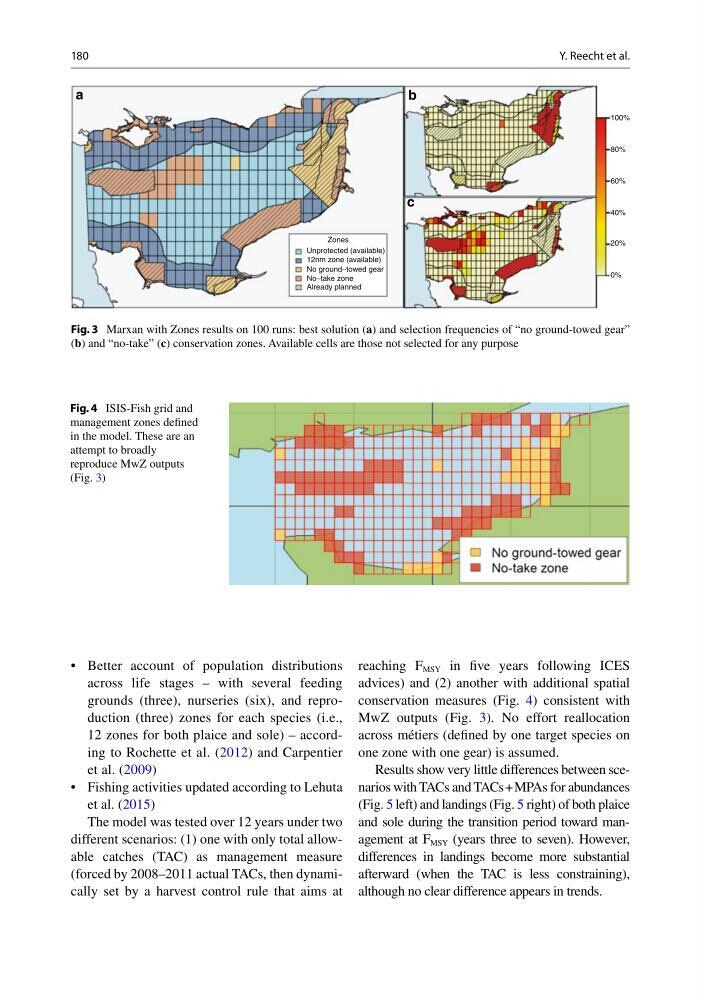
advices) and (2) another with additional spatial
conservation measures (Fig. 4) consistent with
MwZ outputs (Fig. 3). No effort reallocation
across métiers (defined by one target species on
one zone with one gear) is assumed.
Results show very little differences between scenarios with TACs and TACs + MPAs for abundances
(Fig. 5 left) and landings (Fig. 5 right) of both plaice
and sole during the transition period toward management at F MSY (years three to seven). However,
differences in landings become more substantial
afterward (when the TAC is less constraining),
although no clear difference appears in trends.
Unprotected (available)
Zones
a
b
c
100%
80%
60%
40%
20%
0%
12nm zone (available)
No ground−towed gear
No−take zone
Already planned
Fig. 3 Marxan with Zones results on 100 runs: best solution (a) and selection frequencies of “no ground-towed gear”
(b) and “no-take” (c) conservation zones. Available cells are those not selected for any purpose
Fig. 4 ISIS-Fish grid and
management zones defined
in the model. These are an
attempt to broadly
reproduce MwZ outputs
(Fig. 3)
Y. Reecht et al.
• Better account of population distributions
across life stages – with several feeding
grounds (three), nurseries (six), and reproduction (three) zones for each species (i.e.,
12 zones for both plaice and sole) – according to Rochette et al. (2012) and Carpentier
et al. (2009)
• Fishing activities updated according to Lehuta
et al. (2015)
The model was tested over 12 years under two
different scenarios: (1) one with only total allowable catches (TAC) as management measure
(forced by 2008–2011 actual TACs, then dynamically set by a harvest control rule that aims at
reaching F MSY in five years following ICES
advices) and (2) another with additional spatial
conservation measures (Fig. 4) consistent with
MwZ outputs (Fig. 3). No effort reallocation
across métiers (defined by one target species on
one zone with one gear) is assumed.
Results show very little differences between scenarios with TACs and TACs + MPAs for abundances
(Fig. 5 left) and landings (Fig. 5 right) of both plaice
and sole during the transition period toward management at F MSY (years three to seven). However,
differences in landings become more substantial
afterward (when the TAC is less constraining),
although no clear difference appears in trends.
Unprotected (available)
Zones
a
b
c
100%
80%
60%
40%
20%
0%
12nm zone (available)
No ground−towed gear
No−take zone
Already planned
Fig. 3 Marxan with Zones results on 100 runs: best solution (a) and selection frequencies of “no ground-towed gear”
(b) and “no-take” (c) conservation zones. Available cells are those not selected for any purpose
Fig. 4 ISIS-Fish grid and
management zones defined
in the model. These are an
attempt to broadly
reproduce MwZ outputs
(Fig. 3)
Y. Reecht et al.