

144
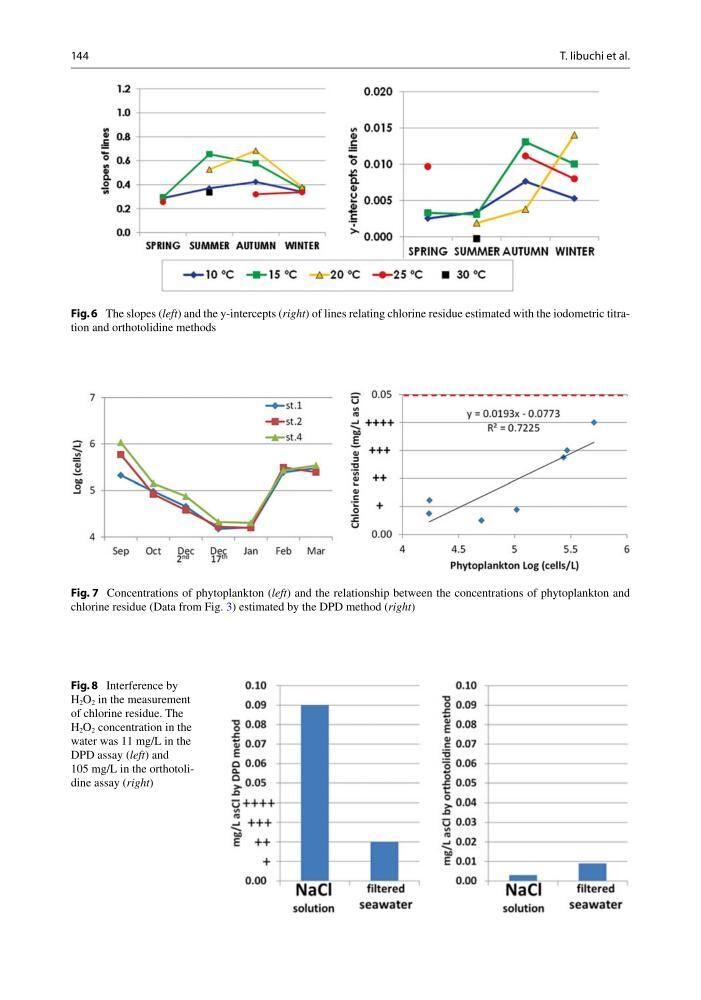
Fig. 6 The slopes ( left ) and the y-intercepts ( right ) of lines relating chlorine residue estimated with the iodometric titration and orthotolidine methods
Fig. 7 Concentrations of phytoplankton ( left ) and the relationship between the concentrations of phytoplankton and
chlorine residue (Data from Fig. 3 ) estimated by the DPD method ( right )
Fig. 8 Interference by
H 2 O 2 in the measurement
of chlorine residue. The
H 2 O 2 concentration in the
water was 11 mg/L in the
DPD assay ( left ) and
105 mg/L in the orthotolidine assay ( right )
T. Iibuchi et al.
Fig. 6 The slopes ( left ) and the y-intercepts ( right ) of lines relating chlorine residue estimated with the iodometric titration and orthotolidine methods
Fig. 7 Concentrations of phytoplankton ( left ) and the relationship between the concentrations of phytoplankton and
chlorine residue (Data from Fig. 3 ) estimated by the DPD method ( right )
Fig. 8 Interference by
H 2 O 2 in the measurement
of chlorine residue. The
H 2 O 2 concentration in the
water was 11 mg/L in the
DPD assay ( left ) and
105 mg/L in the orthotolidine assay ( right )
T. Iibuchi et al.