

142
the standard color solution (0.05 mg/L as Cl) to
0.01, 0.02, 0.03, and 0.04 mg/L as Cl, respectively.
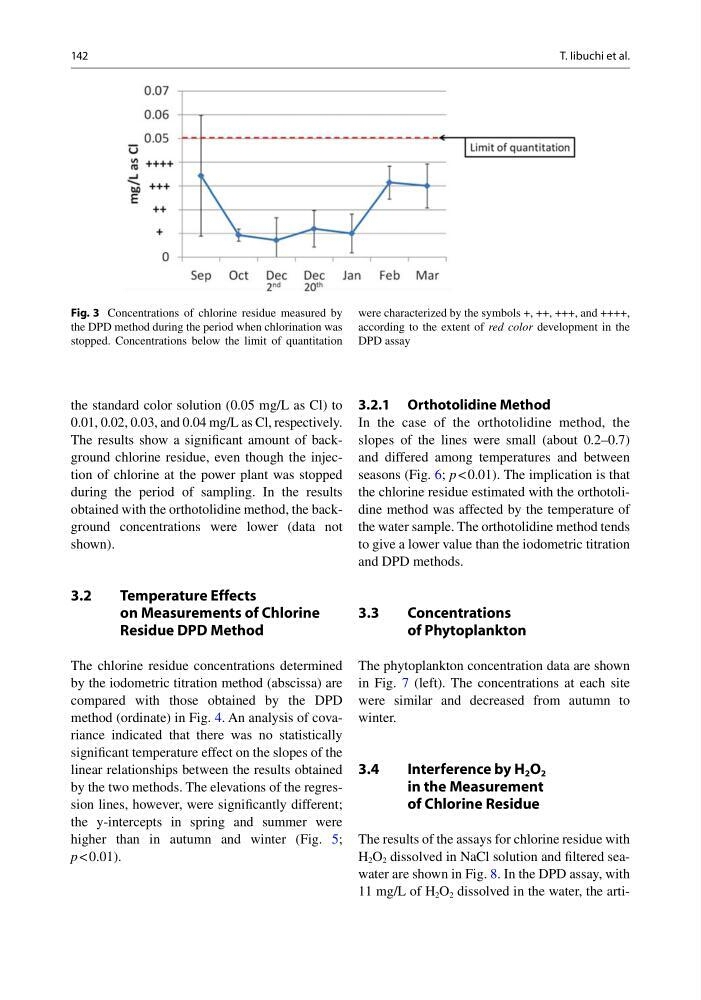
The results show a signifi cant amount of background chlorine residue, even though the injection of chlorine at the power plant was stopped
during the period of sampling. In the results
obtained with the orthotolidine method, the background concentrations were lower (data not
shown).
3.2
Temperature Effects
on Measurements of Chlorine
Residue DPD Method
The chlorine residue concentrations determined
by the iodometric titration method (abscissa) are
compared with those obtained by the DPD
method (ordinate) in Fig. 4 . An analysis of covariance indicated that there was no statistically
signifi cant temperature effect on the slopes of the
linear relationships between the results obtained
by the two methods. The elevations of the regression lines, however, were signifi cantly different;
the y-intercepts in spring and summer were
higher than in autumn and winter (Fig. 5 ;
p < 0.01).
3.2.1 Orthotolidine Method
In the case of the orthotolidine method, the
slopes of the lines were small (about 0.2–0.7)
and differed among temperatures and between
seasons (Fig. 6 ; p < 0.01). The implication is that
the chlorine residue estimated with the orthotolidine method was affected by the temperature of
the water sample. The orthotolidine method tends
to give a lower value than the iodometric titration
and DPD methods.
3.3
Concentrations
of Phytoplankton
The phytoplankton concentration data are shown
in Fig. 7 (left). The concentrations at each site
were similar and decreased from autumn to
winter.
3.4
Interference by H 2 O 2
in the Measurement
of Chlorine Residue
The results of the assays for chlorine residue with
H 2 O 2 dissolved in NaCl solution and fi ltered seawater are shown in Fig. 8 . In the DPD assay, with
11 mg/L of H 2 O 2 dissolved in the water, the artiFig. 3 Concentrations of chlorine residue measured by
the DPD method during the period when chlorination was
stopped. Concentrations below the limit of quantitation
were characterized by the symbols +, ++, +++, and ++++,
according to the extent of red color development in the
DPD assay
T. Iibuchi et al.
the standard color solution (0.05 mg/L as Cl) to
0.01, 0.02, 0.03, and 0.04 mg/L as Cl, respectively.
The results show a signifi cant amount of background chlorine residue, even though the injection of chlorine at the power plant was stopped
during the period of sampling. In the results
obtained with the orthotolidine method, the background concentrations were lower (data not
shown).
3.2
Temperature Effects
on Measurements of Chlorine
Residue DPD Method
The chlorine residue concentrations determined
by the iodometric titration method (abscissa) are
compared with those obtained by the DPD
method (ordinate) in Fig. 4 . An analysis of covariance indicated that there was no statistically
signifi cant temperature effect on the slopes of the
linear relationships between the results obtained
by the two methods. The elevations of the regression lines, however, were signifi cantly different;
the y-intercepts in spring and summer were
higher than in autumn and winter (Fig. 5 ;
p < 0.01).
3.2.1 Orthotolidine Method
In the case of the orthotolidine method, the
slopes of the lines were small (about 0.2–0.7)
and differed among temperatures and between
seasons (Fig. 6 ; p < 0.01). The implication is that
the chlorine residue estimated with the orthotolidine method was affected by the temperature of
the water sample. The orthotolidine method tends
to give a lower value than the iodometric titration
and DPD methods.
3.3
Concentrations
of Phytoplankton
The phytoplankton concentration data are shown
in Fig. 7 (left). The concentrations at each site
were similar and decreased from autumn to
winter.
3.4
Interference by H 2 O 2
in the Measurement
of Chlorine Residue
The results of the assays for chlorine residue with
H 2 O 2 dissolved in NaCl solution and fi ltered seawater are shown in Fig. 8 . In the DPD assay, with
11 mg/L of H 2 O 2 dissolved in the water, the artiFig. 3 Concentrations of chlorine residue measured by
the DPD method during the period when chlorination was
stopped. Concentrations below the limit of quantitation
were characterized by the symbols +, ++, +++, and ++++,
according to the extent of red color development in the
DPD assay
T. Iibuchi et al.