

123
resumption of nutrient supply generated by the
power plant activities (Minas 1976 ). During the
sampling period, freshwater discharges reached
150.10
6 m
3 for a volume of the lagoon estimated
at 980.10
6 m
3
. Mean temperature was 21.4 ± 2.1 °C.
Few dinofl agellate and diatom species like
Prorocentrum minimum and Cyclotella sp. have
then always been dominant for both new and
regenerated production (Raimbault et al. 2013 ).
Historically, abundances of P. minimum could
reach 40,000 cells/cm
3 in the lagoon. Before the
water policy management, colored waters were
observed with concentration of up to 660 cells/
cm
3
, and fi sh and mollusk mortality was induced
by toxins close to the paralytic shellfi sh poisoning (PSP) with concentration of 5,184 cells/cm
3
(Belin and Berthome 1988 ). However, since
the fi rst regulation of the power plant discharges
Chlorophyll a concentration (µg/dm 3 )
sampling period
25
20
15
10
5
0
J u n e
1 5
2 0 1 1
J u l y
0 6
2 0 1 1
A u g u s t 3 0
2 0 1 1
S e p t e m
b e r 1 6
2 0 1 1
O
c t o b e r 1 8
2 0 1 1
N
o v e m
b e r 2 3
2 0 1 1
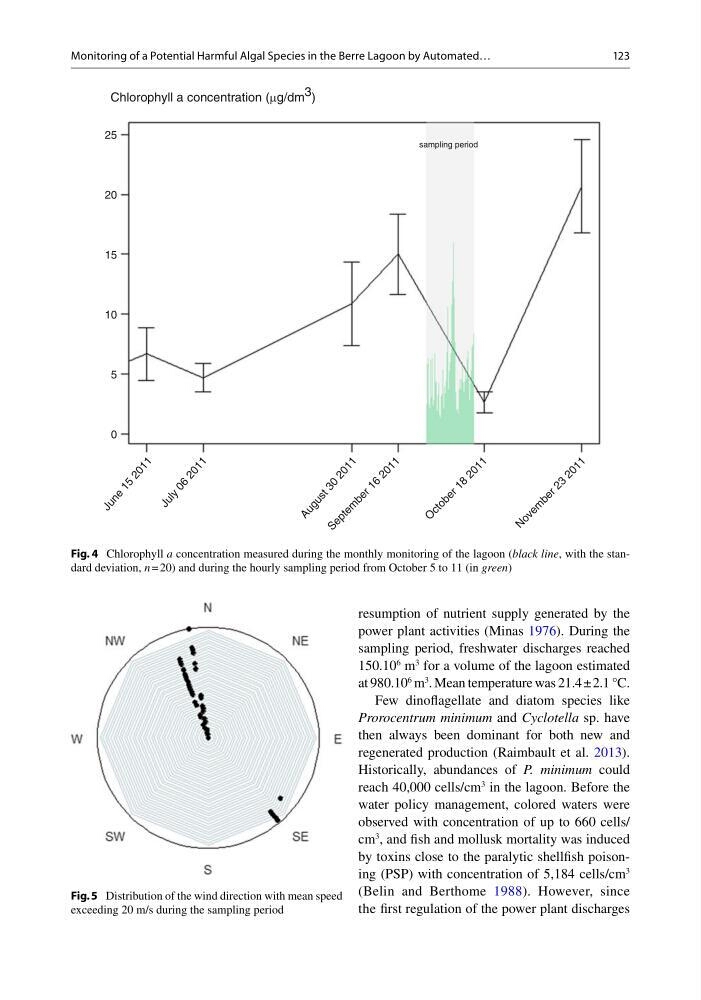
Fig. 4 Chlorophyll a concentration measured during the monthly monitoring of the lagoon ( black line , with the standard deviation, n = 20) and during the hourly sampling period from October 5 to 11 (in green )
Fig. 5 Distribution of the wind direction with mean speed
exceeding 20 m/s during the sampling period
Monitoring of a Potential Harmful Algal Species in the Berre Lagoon by Automated…
resumption of nutrient supply generated by the
power plant activities (Minas 1976 ). During the
sampling period, freshwater discharges reached
150.10
6 m
3 for a volume of the lagoon estimated
at 980.10
6 m
3
. Mean temperature was 21.4 ± 2.1 °C.
Few dinofl agellate and diatom species like
Prorocentrum minimum and Cyclotella sp. have
then always been dominant for both new and
regenerated production (Raimbault et al. 2013 ).
Historically, abundances of P. minimum could
reach 40,000 cells/cm
3 in the lagoon. Before the
water policy management, colored waters were
observed with concentration of up to 660 cells/
cm
3
, and fi sh and mollusk mortality was induced
by toxins close to the paralytic shellfi sh poisoning (PSP) with concentration of 5,184 cells/cm
3
(Belin and Berthome 1988 ). However, since
the fi rst regulation of the power plant discharges
Chlorophyll a concentration (µg/dm 3 )
sampling period
25
20
15
10
5
0
J u n e
1 5
2 0 1 1
J u l y
0 6
2 0 1 1
A u g u s t 3 0
2 0 1 1
S e p t e m
b e r 1 6
2 0 1 1
O
c t o b e r 1 8
2 0 1 1
N
o v e m
b e r 2 3
2 0 1 1
Fig. 4 Chlorophyll a concentration measured during the monthly monitoring of the lagoon ( black line , with the standard deviation, n = 20) and during the hourly sampling period from October 5 to 11 (in green )
Fig. 5 Distribution of the wind direction with mean speed
exceeding 20 m/s during the sampling period
Monitoring of a Potential Harmful Algal Species in the Berre Lagoon by Automated…