

122
from 445.5 cells/cm
3 on October 6, 11:00 pm, to
12.2 cells/cm
3 on October 7, 12:00 pm (Fig. 6 ).
Water turbidity which rose to 15.9 NTU dropped
down to 2.02 ± 0.77 NTU as the biggest autotrophic
cells decreased in abundance. The maximum light
intensity measured in situ increased from 9,300
lux to 14,467 lux, while there was no signifi cant
difference of the solar irradiation.
5
Discussion
Since the instatement of the EDF power plant on
the northern shore of its basin, the Berre lagoon
has been subject to recurrent algal blooms in
spring, summer, and autumn. In October, these
algal proliferations are caused by the persistence
of summer-like temperatures combined with the
Total Red Fluorescence (a.u)
picophytoplankton
nanophytoplankton
microphytoplankton
C1
C2
C3
C4
C6
C7
C9
C11
C5
C8
C10
C12
Akashiwo sanguinea
Prorocentrum micans
Scrippsiella sp.
Gymnodinium sp.
Total Sideward Ligth Scatter (a.u)
5e+05
1e+05
1e+05
1e+06
5e+04
1e+04
1e+04
1e+03
1e+03
1e+02
1e+02
5e+03
5e+02
5e+01
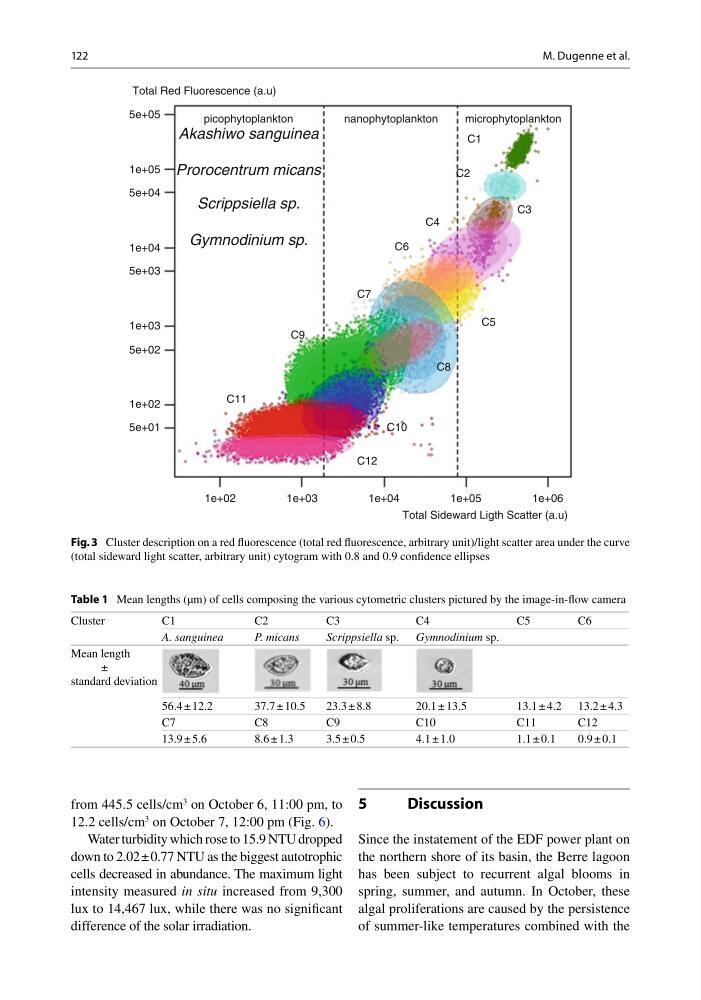
Fig. 3 Cluster description on a red fl uorescence (total red fl uorescence, arbitrary unit)/light scatter area under the curve
(total sideward light scatter, arbitrary unit) cytogram with 0.8 and 0.9 confi dence ellipses
Table 1 Mean lengths (µm) of cells composing the various cytometric clusters pictured by the image-in-fl ow camera
Cluster
C1
C2
C3
C4
C5
C6
A. sanguinea
P. micans
Scrippsiella sp. Gymnodinium sp.
Mean length
±
standard deviation
56.4 ± 12.2
37.7 ± 10.5
23.3 ± 8.8
20.1 ± 13.5
13.1 ± 4.2 13.2 ± 4.3
C7
C8
C9
C10
C11
C12
13.9 ± 5.6
8.6 ± 1.3
3.5 ± 0.5
4.1 ± 1.0
1.1 ± 0.1
0.9 ± 0.1
M. Dugenne et al.
from 445.5 cells/cm
3 on October 6, 11:00 pm, to
12.2 cells/cm
3 on October 7, 12:00 pm (Fig. 6 ).
Water turbidity which rose to 15.9 NTU dropped
down to 2.02 ± 0.77 NTU as the biggest autotrophic
cells decreased in abundance. The maximum light
intensity measured in situ increased from 9,300
lux to 14,467 lux, while there was no signifi cant
difference of the solar irradiation.
5
Discussion
Since the instatement of the EDF power plant on
the northern shore of its basin, the Berre lagoon
has been subject to recurrent algal blooms in
spring, summer, and autumn. In October, these
algal proliferations are caused by the persistence
of summer-like temperatures combined with the
Total Red Fluorescence (a.u)
picophytoplankton
nanophytoplankton
microphytoplankton
C1
C2
C3
C4
C6
C7
C9
C11
C5
C8
C10
C12
Akashiwo sanguinea
Prorocentrum micans
Scrippsiella sp.
Gymnodinium sp.
Total Sideward Ligth Scatter (a.u)
5e+05
1e+05
1e+05
1e+06
5e+04
1e+04
1e+04
1e+03
1e+03
1e+02
1e+02
5e+03
5e+02
5e+01
Fig. 3 Cluster description on a red fl uorescence (total red fl uorescence, arbitrary unit)/light scatter area under the curve
(total sideward light scatter, arbitrary unit) cytogram with 0.8 and 0.9 confi dence ellipses
Table 1 Mean lengths (µm) of cells composing the various cytometric clusters pictured by the image-in-fl ow camera
Cluster
C1
C2
C3
C4
C5
C6
A. sanguinea
P. micans
Scrippsiella sp. Gymnodinium sp.
Mean length
±
standard deviation
56.4 ± 12.2
37.7 ± 10.5
23.3 ± 8.8
20.1 ± 13.5
13.1 ± 4.2 13.2 ± 4.3
C7
C8
C9
C10
C11
C12
13.9 ± 5.6
8.6 ± 1.3
3.5 ± 0.5
4.1 ± 1.0
1.1 ± 0.1
0.9 ± 0.1
M. Dugenne et al.