

126
5 Conservation Costs of PGRFA
was that less than US $ 240 million were contributed annually (Zedan, 1996). This
result proofs that the estimations presented in this study are in an acceptable range
of magnitude, based on the assumption that far more financial resources are
contributed for the conservation of biodiversity in general than it is for
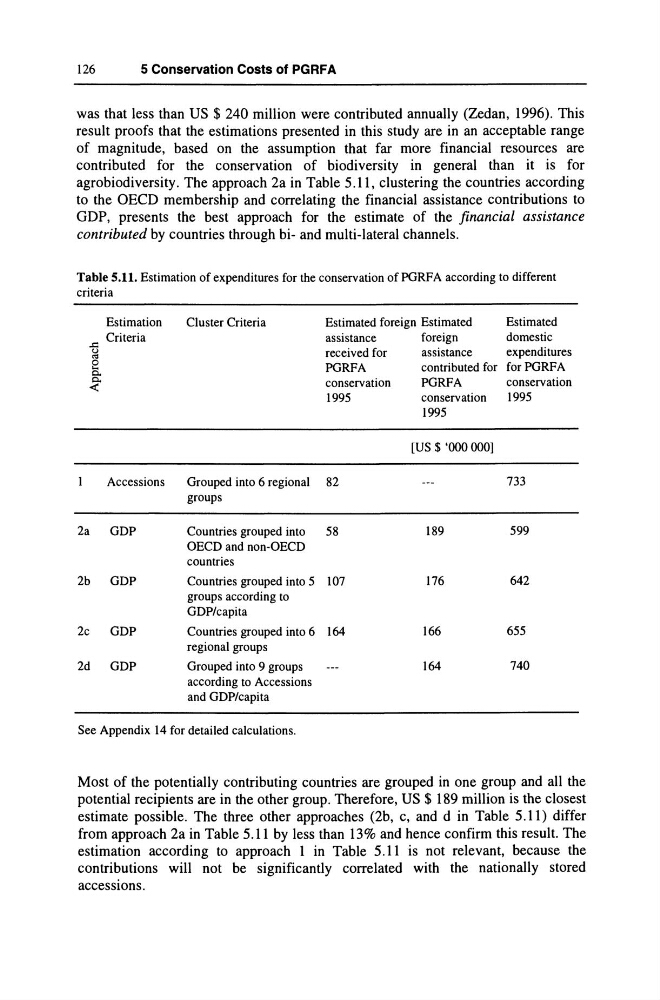
agrobiodiversity. The approach 2a in Table 5.11, clustering the countries according
to the DECD membership and correlating the financial assistance contributions to
GDP, presents the best approach for the estimate of the financial assistance
contributed by countries through bi- and multi-lateral channels.
Table 5.11. Estimation of expenditures for the conservation of PGRFA according to different
criteria
Estimation
Cluster Criteria
Estimated foreign Estimated
Estimated
Criteria
assistance
foreign
domestic
..c
<.l
received for
assistance
expenditures
'" 8
PGRFA
contributed for forPGRFA
~
~
conservation
PGRFA
conservation
«
1995
conservation
1995
1995
[US $ '000 000)
Accessions
Grouped into 6 regional 82
733
groups
2a
GDP
Countries grouped into
58
189
599
OECD and non-OECD
countries
2b
GDP
Countries grouped into 5 107
176
642
groups according to
GDP/capita
2c
GDP
Countries grouped into 6 164
166
655
regional groups
2d
GDP
Grouped into 9 groups
164
740
according to Accessions
and GDP/capita
See Appendix 14 for detailed calculations.
Most of the potentially contributing countries are grouped in one group and all the
potential recipients are in the other group. Therefore, US $ 189 million is the closest
estimate possible. The three other approaches (2b, c, and d in Table 5.11) differ
from approach 2a in Table 5.11 by less than 13% and hence confirm this result. The
estimation according to approach 1 in Table 5.11 is not relevant, because the
contributions will not be significantly correlated with the nationally stored
accessions.
5 Conservation Costs of PGRFA
was that less than US $ 240 million were contributed annually (Zedan, 1996). This
result proofs that the estimations presented in this study are in an acceptable range
of magnitude, based on the assumption that far more financial resources are
contributed for the conservation of biodiversity in general than it is for
agrobiodiversity. The approach 2a in Table 5.11, clustering the countries according
to the DECD membership and correlating the financial assistance contributions to
GDP, presents the best approach for the estimate of the financial assistance
contributed by countries through bi- and multi-lateral channels.
Table 5.11. Estimation of expenditures for the conservation of PGRFA according to different
criteria
Estimation
Cluster Criteria
Estimated foreign Estimated
Estimated
Criteria
assistance
foreign
domestic
..c
<.l
received for
assistance
expenditures
'" 8
PGRFA
contributed for forPGRFA
~
~
conservation
PGRFA
conservation
«
1995
conservation
1995
1995
[US $ '000 000)
Accessions
Grouped into 6 regional 82
733
groups
2a
GDP
Countries grouped into
58
189
599
OECD and non-OECD
countries
2b
GDP
Countries grouped into 5 107
176
642
groups according to
GDP/capita
2c
GDP
Countries grouped into 6 164
166
655
regional groups
2d
GDP
Grouped into 9 groups
164
740
according to Accessions
and GDP/capita
See Appendix 14 for detailed calculations.
Most of the potentially contributing countries are grouped in one group and all the
potential recipients are in the other group. Therefore, US $ 189 million is the closest
estimate possible. The three other approaches (2b, c, and d in Table 5.11) differ
from approach 2a in Table 5.11 by less than 13% and hence confirm this result. The
estimation according to approach 1 in Table 5.11 is not relevant, because the
contributions will not be significantly correlated with the nationally stored
accessions.