

Limitations of Melting Curve Analysis Using SYBR Green I - Fragment Differentiation and Mutation Detection .
6.5
6
5.5
3
2.5
15
0.5
D I
70
I
n
I
7S
-
wtJwt
I
79
I
I
I
80
82
84
'_""""I'C)
-
G542XJwt
I
116
I
88
I
90
I
92
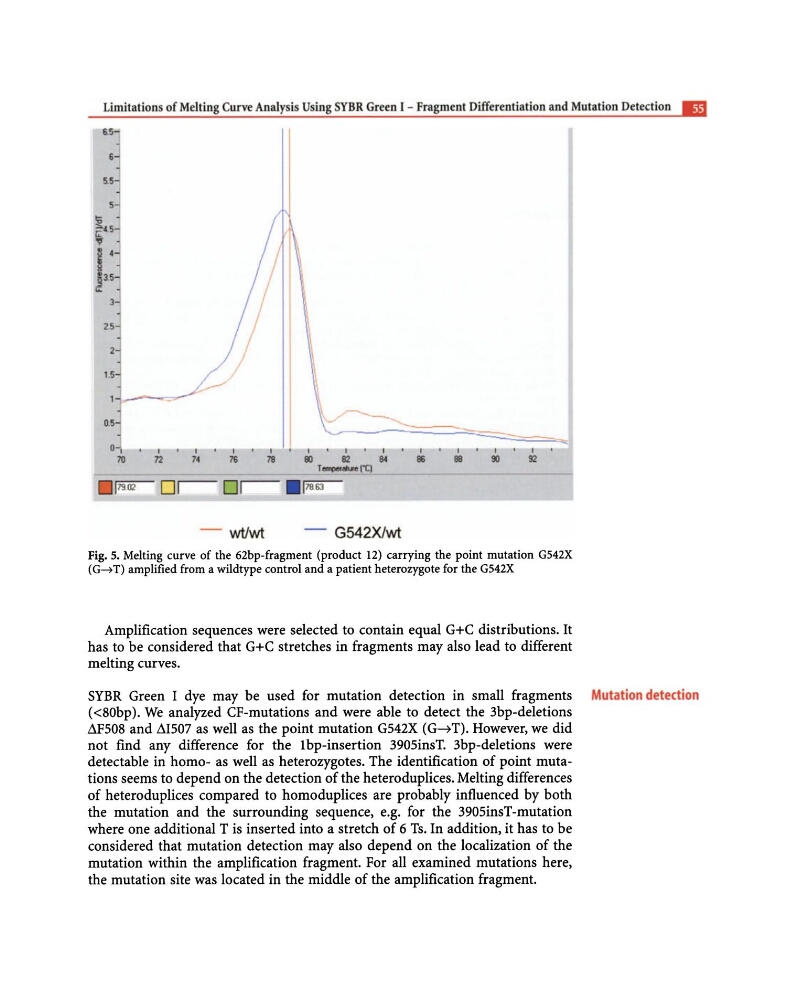
Fig. 5. Melting curve of the 62bp-fragment (product 12) carrying the point mutation G542X
(G~T) amplified from a wildtype control and a patient heterozygote for the G542X
Amplification sequences were selected to contain equal G+C distributions. It
has to be considered that G+C stretches in fragments may also lead to different
melting curves.
SYBR Green I dye may be used for mutation detection in small fragments Mutation detection
«80bp). We analyzed CF-mutations and were able to detect the 3bp-deletions
dFS08 and L1IS07 as well as the point mutation GS42X (G~T). However, we did
not find any difference for the Ibp-insertion 390SinsT. 3bp-deletions were
detectable in homo- as well as heterozygotes. The identification of point mutations seems to depend on the detection of the heteroduplices. Melting differences
of heteroduplices compared to homoduplices are probably influenced by both
the mutation and the surrounding sequence, e.g. for the 390SinsT-mutation
where one additional T is inserted into a stretch of 6 Ts. In addition, it has to be
considered that mutation detection may also depend on the localization of the
mutation within the amplification fragment. For all examined mutations here,
the mutation site was located in the middle of the amplification fragment.
6.5
6
5.5
3
2.5
15
0.5
D I
70
I
n
I
7S
-
wtJwt
I
79
I
I
I
80
82
84
'_""""I'C)
-
G542XJwt
I
116
I
88
I
90
I
92
Fig. 5. Melting curve of the 62bp-fragment (product 12) carrying the point mutation G542X
(G~T) amplified from a wildtype control and a patient heterozygote for the G542X
Amplification sequences were selected to contain equal G+C distributions. It
has to be considered that G+C stretches in fragments may also lead to different
melting curves.
SYBR Green I dye may be used for mutation detection in small fragments Mutation detection
«80bp). We analyzed CF-mutations and were able to detect the 3bp-deletions
dFS08 and L1IS07 as well as the point mutation GS42X (G~T). However, we did
not find any difference for the Ibp-insertion 390SinsT. 3bp-deletions were
detectable in homo- as well as heterozygotes. The identification of point mutations seems to depend on the detection of the heteroduplices. Melting differences
of heteroduplices compared to homoduplices are probably influenced by both
the mutation and the surrounding sequence, e.g. for the 390SinsT-mutation
where one additional T is inserted into a stretch of 6 Ts. In addition, it has to be
considered that mutation detection may also depend on the localization of the
mutation within the amplification fragment. For all examined mutations here,
the mutation site was located in the middle of the amplification fragment.