

Limitations of Melting Curve Analysis Using SY BR Green I - Fragment Differentiation and Mutation Detection . ,
T m = 8 1.5+ 16.6* lg ([salt] 1 (1 +0.7* [5alt]))+0.41 * (%GC)-( SOOIL)+(2.09*e-1•1S'SYBRdllution)
(salt] = [Na/ K]+4 [Mg++-dNTP]O .S+[ Tri5+]' for buffers at 3mM Mg++ [salt] = 0.20
L = fragment length
Fig. 2. Relation between fragment length, GC content [5], and melting point (Tm)
A
' 4 ~----------------------------------------------------~
B
' 2
.0.2 I • I •
I
I I
I
•
I I
I
I
I
I
I
•
I I
I
•
t
I
I
~
~
m n
N
~
ro
00
m ~ ~ ~ 00
T omPC1
wUwt
- llF508Iwt - llF508IllF508
waler
I
I
92
!i'
4 ~~======================================~
0I
I
I
I
I
I
I
I
'
I
•
I
'
I
•
I
•
I
I '
I
I
I
I
~
~
m
R
N
~
ro
00
~
~
~
~
00
92
!i'
T _oture ("C]
- wVwt
- 111507/wt
- 1115071 Ll1507
water
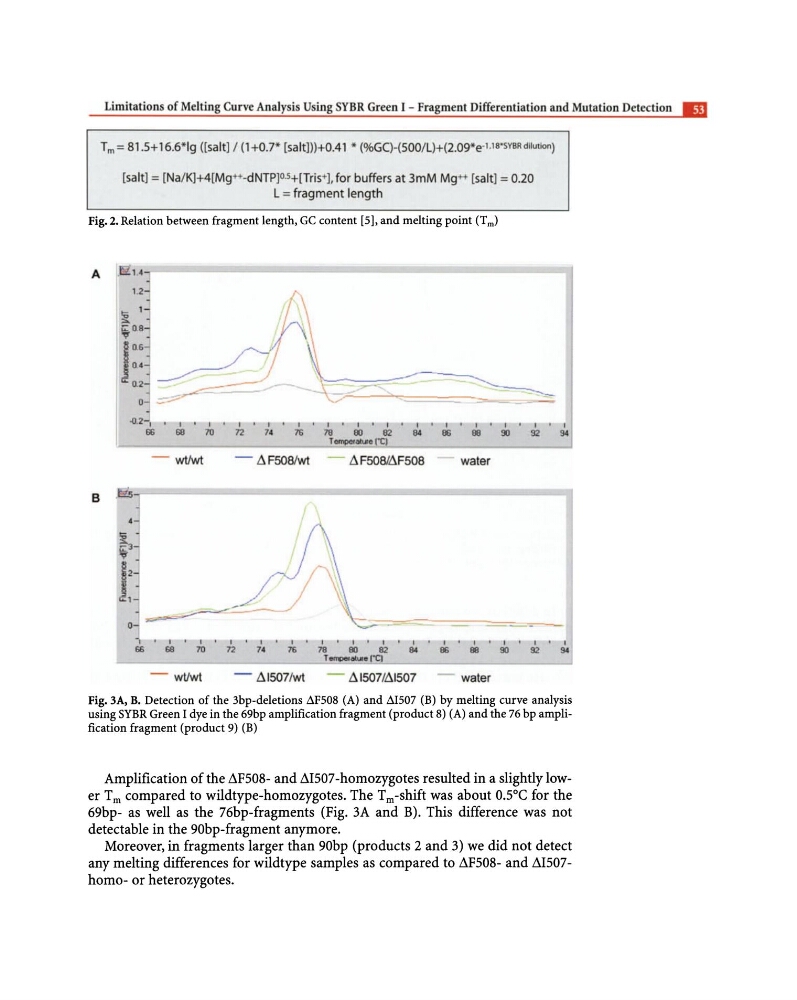
Fig. 3A, B. Detection of the 3bp-deletions .::lF508 (A) and .::lI507 (B) by melting curve analysis
using SYBR Green I dye in the 69bp amplification fragment (product 8) (A) and the 76 bp amplification fragment (product 9) (B)
Amplification of the llFS08- and !lIS07 -homozygotes resulted in a slightly lower Tm compared to wildtype-homozygotes. The Tm-shift was about Osc for the
69bp- as well as the 76bp-fragments (Fig. 3A and B). This difference was not
detectable in the 90bp-fragment anymore.
Moreover, in fragments larger than 90bp (products 2 and 3) we did not detect
any melting differences for wildtype samples as compared to llFS08- and !lIS07homo- or heterozygotes.
T m = 8 1.5+ 16.6* lg ([salt] 1 (1 +0.7* [5alt]))+0.41 * (%GC)-( SOOIL)+(2.09*e-1•1S'SYBRdllution)
(salt] = [Na/ K]+4 [Mg++-dNTP]O .S+[ Tri5+]' for buffers at 3mM Mg++ [salt] = 0.20
L = fragment length
Fig. 2. Relation between fragment length, GC content [5], and melting point (Tm)
A
' 4 ~----------------------------------------------------~
B
' 2
.0.2 I • I •
I
I I
I
•
I I
I
I
I
I
I
•
I I
I
•
t
I
I
~
~
m n
N
~
ro
00
m ~ ~ ~ 00
T omPC1
wUwt
- llF508Iwt - llF508IllF508
waler
I
I
92
!i'
4 ~~======================================~
0I
I
I
I
I
I
I
I
'
I
•
I
'
I
•
I
•
I
I '
I
I
I
I
~
~
m
R
N
~
ro
00
~
~
~
~
00
92
!i'
T _oture ("C]
- wVwt
- 111507/wt
- 1115071 Ll1507
water
Fig. 3A, B. Detection of the 3bp-deletions .::lF508 (A) and .::lI507 (B) by melting curve analysis
using SYBR Green I dye in the 69bp amplification fragment (product 8) (A) and the 76 bp amplification fragment (product 9) (B)
Amplification of the llFS08- and !lIS07 -homozygotes resulted in a slightly lower Tm compared to wildtype-homozygotes. The Tm-shift was about Osc for the
69bp- as well as the 76bp-fragments (Fig. 3A and B). This difference was not
detectable in the 90bp-fragment anymore.
Moreover, in fragments larger than 90bp (products 2 and 3) we did not detect
any melting differences for wildtype samples as compared to llFS08- and !lIS07homo- or heterozygotes.