

a
b
c
Quantitative Two-Step RT-PCR for the Detection of Human ABCAI Transporter on LightCycler . .
Amplification
SIop'_1 SIopl_S..., S1OO1""' 1
0..1 ,
I
•
I '
I
I
I
t
I
~
~
~
~
~
~
~
~
CocIeH..I
I
I
I
I
Standard
JO
- u-~ J~:
• c-.g_ s~
Siapo •. lsen
~2.j
1_.1152
~.:
,··1.m
1.";
o!j
Meltin Curves
1.2I -
t;;
~G.8:
r~:
020,
I
55
6Il
I
65
I
-c.s
l6
38
...
<12
..
N_
~ _01 ...
_001 ...
_l1li1 ...
_...o.OIIJ01 ...
u,g1 . . '
~ """~
SIOndood
001!1JO
0,00111JO
D.1III111JO
D.0IIJ0111JO
I
90
,
0,01~
0'00095G
OIllJO!MO
0'0IIJ0111G
D.1DlJ61
0JlII021S
I
1115
t\o.
19.13
Zl19
Z71Z
3083
2482
aJO
I
90
,
~
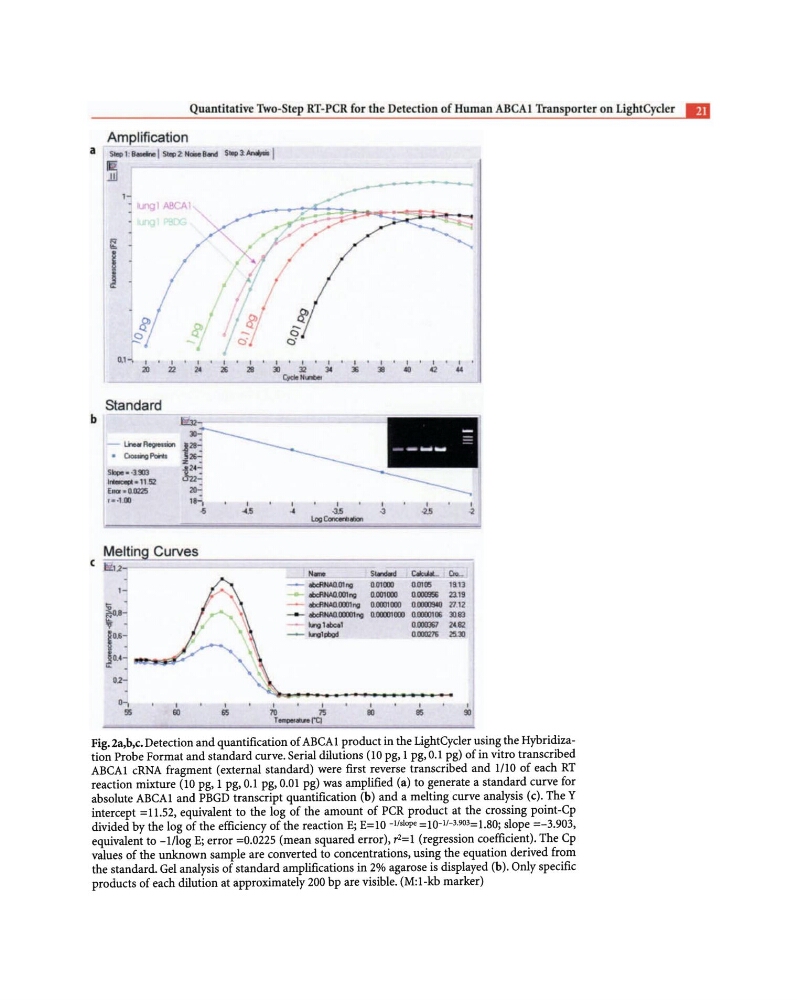
Fig.2a,b,c.Detection and quantification of ABCAI product in the LightCyder using the Hybridization Probe Format and standard curve. Serial dilutions (10 pg, 1 pg, 0.1 pg) of in vitro transcribed
ABCAI cRNA fragment (external standard) were first reverse transcribed and 1/10 of each RT
reaction mixture (10 pg, 1 pg, 0.1 pg, 0.01 pg) was amplified (a) to generate a standard curve for
absolute ABCAI and PBGD transcript quantification (b) and a melting curve analysis (c). The Y
intercept =11.52, equivalent to the log of the amount of PCR product at the crossing point-Cp
divided by the log of the efficiency of the reaction E; E=10 -l/slope =10-11- 3.903=1.80; slope =-3.903,
equivalent to -lIlog E; error =0.0225 (mean squared error), r 2 =1 (regression coefficient). The Cp
values of the unknown sample are converted to concentrations, using the equation derived from
the standard. Gel analysis of standard amplifications in 2% agarose is displayed (b). Only specific
products of each dilution at approximately 200 bp are visible. (M:l-kb marker)
b
c
Quantitative Two-Step RT-PCR for the Detection of Human ABCAI Transporter on LightCycler . .
Amplification
SIop'_1 SIopl_S..., S1OO1""' 1
0..1 ,
I
•
I '
I
I
I
t
I
~
~
~
~
~
~
~
~
CocIeH..I
I
I
I
I
Standard
JO
- u-~ J~:
• c-.g_ s~
Siapo •. lsen
~2.j
1_.1152
~.:
,··1.m
1.";
o!j
Meltin Curves
1.2I -
t;;
~G.8:
r~:
020,
I
55
6Il
I
65
I
-c.s
l6
38
...
<12
..
N_
~ _01 ...
_001 ...
_l1li1 ...
_...o.OIIJ01 ...
u,g1 . . '
~ """~
SIOndood
001!1JO
0,00111JO
D.1III111JO
D.0IIJ0111JO
I
90
,
0,01~
0'00095G
OIllJO!MO
0'0IIJ0111G
D.1DlJ61
0JlII021S
I
1115
t\o.
19.13
Zl19
Z71Z
3083
2482
aJO
I
90
,
~
Fig.2a,b,c.Detection and quantification of ABCAI product in the LightCyder using the Hybridization Probe Format and standard curve. Serial dilutions (10 pg, 1 pg, 0.1 pg) of in vitro transcribed
ABCAI cRNA fragment (external standard) were first reverse transcribed and 1/10 of each RT
reaction mixture (10 pg, 1 pg, 0.1 pg, 0.01 pg) was amplified (a) to generate a standard curve for
absolute ABCAI and PBGD transcript quantification (b) and a melting curve analysis (c). The Y
intercept =11.52, equivalent to the log of the amount of PCR product at the crossing point-Cp
divided by the log of the efficiency of the reaction E; E=10 -l/slope =10-11- 3.903=1.80; slope =-3.903,
equivalent to -lIlog E; error =0.0225 (mean squared error), r 2 =1 (regression coefficient). The Cp
values of the unknown sample are converted to concentrations, using the equation derived from
the standard. Gel analysis of standard amplifications in 2% agarose is displayed (b). Only specific
products of each dilution at approximately 200 bp are visible. (M:l-kb marker)