

Measurement of MDRl Gene Expression by Real-Time Quantitative RT-PCR Using the LightCyder Instrument Fl'iD
amplicons. For the prepared cDNA, 132 micro globulin, a housekeeping enzyme
was amplified separately to examine the quality of the RNA retrieved.
Results
When the 3' -flourescein-Iabeled probe was annealed to the extension product of
the CyS-labeled primer, the fluorophores were brought into close enough contact
for FRET to occur, resulting in increased fluorescence of CyS that reflects the
cumulative amount of the products with advancing cycles. The PCR cycle number
at which the fluorescence intensity of CyS became greater than the base line was
defined as the "threshold cycle number" (Fig. I). The quantification curve was
established by plotting the log of the copy number of templates used for amplification versus the threshold cycle number. The results showed a linear inverse correlation (Fig. 2, R2=O.998, P
or Tm). The Tm depends on the stability of the probe-product hybridized double
strand structure. For a homogenous PCR product, the T m can be used to assure
the PCR products are the target products but not other contaminants. The specificity of the MDRI products was verified by the Tm (68.1°C) immediately after the
completion of the PCR reaction.
0.30
0.28
0.26
0.24
0.22
u::
N
0.20
~ 0.18
Ql
0.16
u
c:
8
0.14
'" 0.12
Q)
0 0.10
::::I
iI 0.08
0.06
0.04
0.02
0
1 2
8
10 12 14 16 18 20
22 24 16 28 30 :12 34 36 38 ~ 42 44 4S
peR cycle number
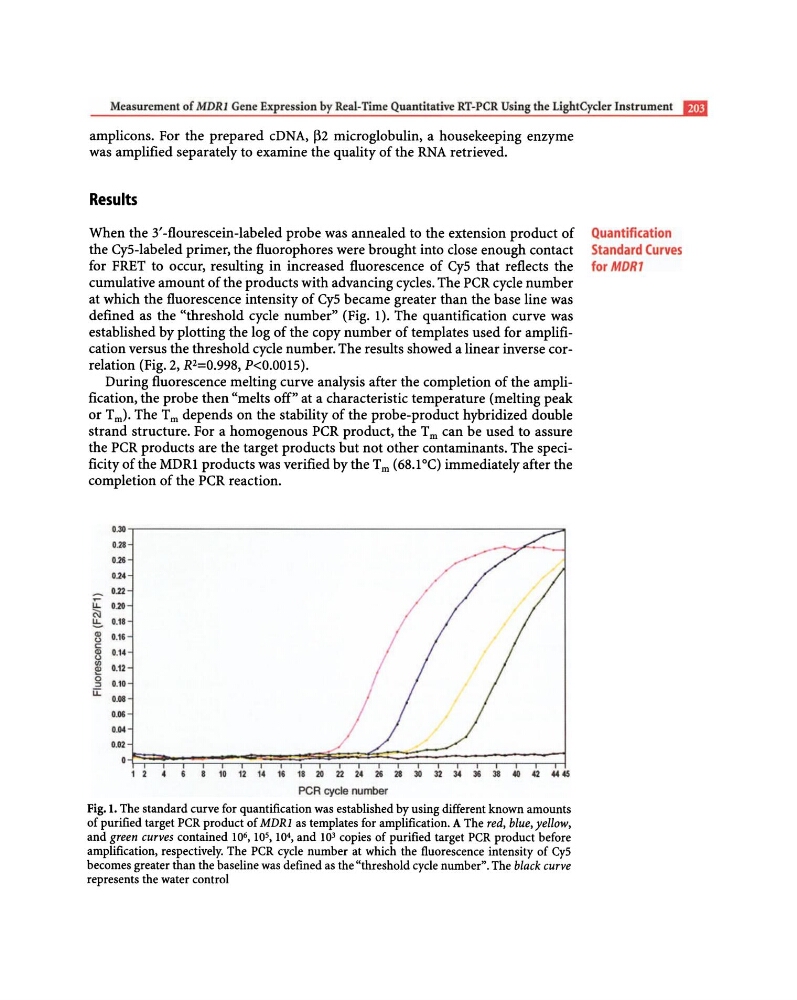
Fig.!. The standard curve for quantification was established by using different known amounts
of purified target peR product of MDRI as templates for amplification. A The red, blue, yellow,
and green curves contained 10 6 ,105,104, and 103 copies of purified target peR product before
amplification, respectively. The peR cycle number at which the fluorescence intensity of CyS
becomes greater than the baseline was defined as the "threshold cycle number". The black curve
represents the water control
Quantification
Standard Curves
for MDRl
amplicons. For the prepared cDNA, 132 micro globulin, a housekeeping enzyme
was amplified separately to examine the quality of the RNA retrieved.
Results
When the 3' -flourescein-Iabeled probe was annealed to the extension product of
the CyS-labeled primer, the fluorophores were brought into close enough contact
for FRET to occur, resulting in increased fluorescence of CyS that reflects the
cumulative amount of the products with advancing cycles. The PCR cycle number
at which the fluorescence intensity of CyS became greater than the base line was
defined as the "threshold cycle number" (Fig. I). The quantification curve was
established by plotting the log of the copy number of templates used for amplification versus the threshold cycle number. The results showed a linear inverse correlation (Fig. 2, R2=O.998, P
or Tm). The Tm depends on the stability of the probe-product hybridized double
strand structure. For a homogenous PCR product, the T m can be used to assure
the PCR products are the target products but not other contaminants. The specificity of the MDRI products was verified by the Tm (68.1°C) immediately after the
completion of the PCR reaction.
0.30
0.28
0.26
0.24
0.22
u::
N
0.20
~ 0.18
Ql
0.16
u
c:
8
0.14
'" 0.12
Q)
0 0.10
::::I
iI 0.08
0.06
0.04
0.02
0
1 2
8
10 12 14 16 18 20
22 24 16 28 30 :12 34 36 38 ~ 42 44 4S
peR cycle number
Fig.!. The standard curve for quantification was established by using different known amounts
of purified target peR product of MDRI as templates for amplification. A The red, blue, yellow,
and green curves contained 10 6 ,105,104, and 103 copies of purified target peR product before
amplification, respectively. The peR cycle number at which the fluorescence intensity of CyS
becomes greater than the baseline was defined as the "threshold cycle number". The black curve
represents the water control
Quantification
Standard Curves
for MDRl