

m Applications in Oncology
Establishing the
Quantification Standard Curves for MOR1
Using Different
Known Amounts of
Target PCR Products
Quantification of
MDRl Expression in
Different Cell lines
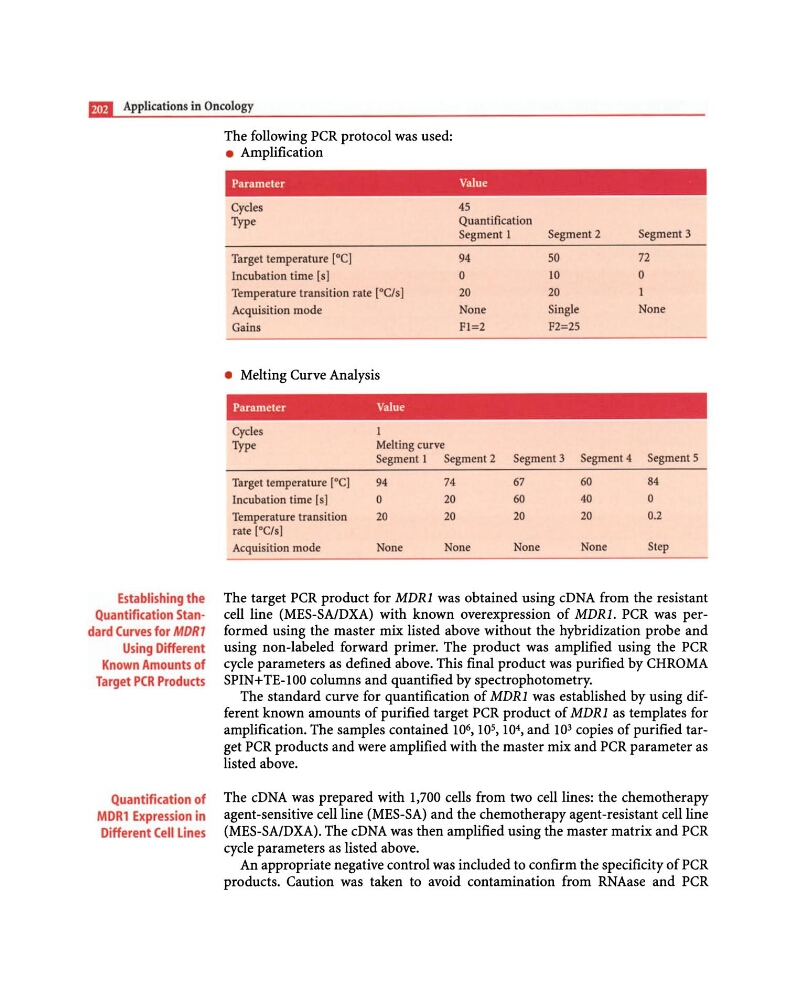
The following PCR protocol was used:
• Amplification
Parameter
Value
45
Cycles
Type
Quantification
Targetternperature [Oe]
Incubation time [s]
Temperature transition rate [OC/s]
Acquisition mode
Gains
• Melting Curve Analysis
Parameter
Value
Cycles
Segment 1
94
0
20
None
Fl=2
Type
Melting curve
Segment 1 Segment 2
Target temperature rOC]
94
74
Incubation time [s]
0
20
Temperature transition
20
20
rate [OC/s]
Acquisition mode
None
None
Segment 2
50
10
20
Single
F2=25
Segment 3 Segment 4
67
60
60
40
20
20
None
None
Segment 3
72
0
None
Segment 5
84
0
0.2
Step
The target PCR product for MDRl was obtained using cDNA from the resistant
cell line (MES-SA/DXA) with known overexpression of MDR1. PCR was performed using the master mix listed above without the hybridization probe and
using non-labeled forward primer. The product was amplified using the PCR
cycle parameters as defined above. This final product was purified by CHROMA
SPIN+TE-I00 columns and quantified by spectrophotometry.
The standard curve for quantification of MDRl was established by using different known amounts of purified target PCR product of MDRl as templates for
amplification. The samples contained 10 6 ,10 5 ,104, and 10 3 copies of purified target PCR products and were amplified with the master mix and PCR parameter as
listed above.
The cDNA was prepared with 1,700 cells from two cell lines: the chemotherapy
agent-sensitive cell line (MES-SA) and the chemotherapy agent-resistant cell line
(MES-SA/DXA). The cDNA was then amplified using the master matrix and PCR
cycle parameters as listed above.
An appropriate negative control was included to confirm the specificity of PCR
products. Caution was taken to avoid contamination from RNAase and PCR
Establishing the
Quantification Standard Curves for MOR1
Using Different
Known Amounts of
Target PCR Products
Quantification of
MDRl Expression in
Different Cell lines
The following PCR protocol was used:
• Amplification
Parameter
Value
45
Cycles
Type
Quantification
Targetternperature [Oe]
Incubation time [s]
Temperature transition rate [OC/s]
Acquisition mode
Gains
• Melting Curve Analysis
Parameter
Value
Cycles
Segment 1
94
0
20
None
Fl=2
Type
Melting curve
Segment 1 Segment 2
Target temperature rOC]
94
74
Incubation time [s]
0
20
Temperature transition
20
20
rate [OC/s]
Acquisition mode
None
None
Segment 2
50
10
20
Single
F2=25
Segment 3 Segment 4
67
60
60
40
20
20
None
None
Segment 3
72
0
None
Segment 5
84
0
0.2
Step
The target PCR product for MDRl was obtained using cDNA from the resistant
cell line (MES-SA/DXA) with known overexpression of MDR1. PCR was performed using the master mix listed above without the hybridization probe and
using non-labeled forward primer. The product was amplified using the PCR
cycle parameters as defined above. This final product was purified by CHROMA
SPIN+TE-I00 columns and quantified by spectrophotometry.
The standard curve for quantification of MDRl was established by using different known amounts of purified target PCR product of MDRl as templates for
amplification. The samples contained 10 6 ,10 5 ,104, and 10 3 copies of purified target PCR products and were amplified with the master mix and PCR parameter as
listed above.
The cDNA was prepared with 1,700 cells from two cell lines: the chemotherapy
agent-sensitive cell line (MES-SA) and the chemotherapy agent-resistant cell line
(MES-SA/DXA). The cDNA was then amplified using the master matrix and PCR
cycle parameters as listed above.
An appropriate negative control was included to confirm the specificity of PCR
products. Caution was taken to avoid contamination from RNAase and PCR