

1m Applications in Oncology
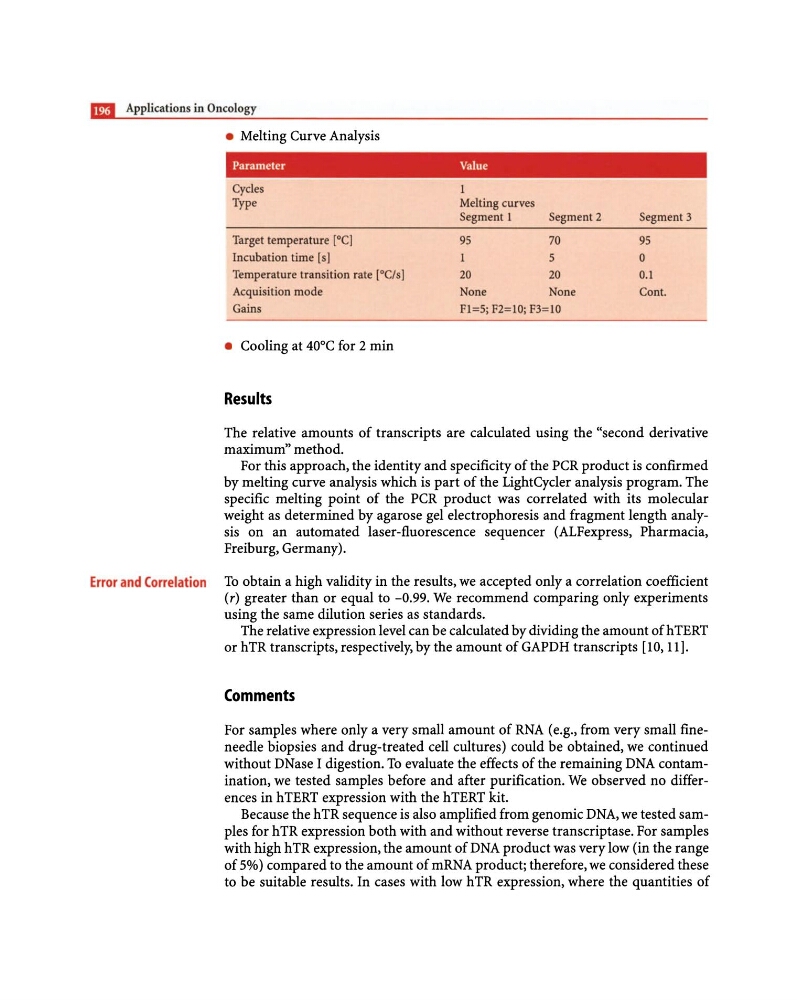
• Melting Curve Analysis
Parameter
Value
Cycles
Type
Target temperature [0C]
Incubation time [sl
Temperature trans ition rate ('Cls I
Acquisition mode
Gains
• Cooling at 40°C for 2 min
Results
Melting curves
Segment 1
Segment 2
9S
70
5
20
20
None
None
Fl=5; F2=10; F3=10
Segment 3
95
0
0.1
Cont.
The relative amounts of transcripts are calculated using the "second derivative
maximum" method.
For this approach, the identity and specificity of the PCR product is confirmed
by melting curve analysis which is part of the LightCycler analysis program. The
specific melting point of the PCR product was correlated with its molecular
weight as determined by agarose gel electrophoresis and fragment length analysis on an automated laser-fluorescence sequencer (ALFexpress, Pharmacia,
Freiburg, Germany).
Error and Correlation To obtain a high validity in the results, we accepted only a correlation coefficient
(r) greater than or equal to -0.99. We recommend comparing only experiments
using the same dilution series as standards.
The relative expression level can be calculated by dividing the amount ofhTERT
or hTR transcripts, respectively, by the amount of GAPDH transcripts [10,11].
Comments
For samples where only a very small amount of RNA (e.g., from very small fineneedle biopsies and drug-treated cell cultures) could be obtained, we continued
without DNase I digestion. To evaluate the effects of the remaining DNA contamination, we tested samples before and after purification. We observed no differences in hTERT expression with the hTERT kit.
Because the hTR sequence is also amplified from genomic DNA, we tested samples for hTR expression both with and without reverse transcriptase. For samples
with high hTR expression, the amount of DNA product was very low (in the range
of 5%) compared to the amount of mRNA product; therefore, we considered these
to be suitable results. In cases with low hTR expression, where the quantities of
• Melting Curve Analysis
Parameter
Value
Cycles
Type
Target temperature [0C]
Incubation time [sl
Temperature trans ition rate ('Cls I
Acquisition mode
Gains
• Cooling at 40°C for 2 min
Results
Melting curves
Segment 1
Segment 2
9S
70
5
20
20
None
None
Fl=5; F2=10; F3=10
Segment 3
95
0
0.1
Cont.
The relative amounts of transcripts are calculated using the "second derivative
maximum" method.
For this approach, the identity and specificity of the PCR product is confirmed
by melting curve analysis which is part of the LightCycler analysis program. The
specific melting point of the PCR product was correlated with its molecular
weight as determined by agarose gel electrophoresis and fragment length analysis on an automated laser-fluorescence sequencer (ALFexpress, Pharmacia,
Freiburg, Germany).
Error and Correlation To obtain a high validity in the results, we accepted only a correlation coefficient
(r) greater than or equal to -0.99. We recommend comparing only experiments
using the same dilution series as standards.
The relative expression level can be calculated by dividing the amount ofhTERT
or hTR transcripts, respectively, by the amount of GAPDH transcripts [10,11].
Comments
For samples where only a very small amount of RNA (e.g., from very small fineneedle biopsies and drug-treated cell cultures) could be obtained, we continued
without DNase I digestion. To evaluate the effects of the remaining DNA contamination, we tested samples before and after purification. We observed no differences in hTERT expression with the hTERT kit.
Because the hTR sequence is also amplified from genomic DNA, we tested samples for hTR expression both with and without reverse transcriptase. For samples
with high hTR expression, the amount of DNA product was very low (in the range
of 5%) compared to the amount of mRNA product; therefore, we considered these
to be suitable results. In cases with low hTR expression, where the quantities of