

P'"
u..
-- I'll
u..
cu
..,
c:
cu
..,
III
CU
...
::I
0
u:::
a
~
.,
D
E
"
z
b
c
Expression Analysis of Telomerase-Genes hTERT and hTR by Quantitative pe R on LightCyd er mJ
2.8211 -
2.4 -
22 -
'.81 .81
1.2- - 1) neg. controt hTR
•• • •• • 2) Stan~.rd 1
. _-- 3) Sl.n~.rd 2
"'-" 4) SlaMard J
•••••• 5) Standard 4
• • ••• • 6) standard 5
- • - 7) po • . con~ol hTR
- - 8) Sample hTR
9) neg. tonkol PBOD
-
- 10) poe, conkol PBOD
- - 11) Sample PBOD
......•.. :.::: ... ~::~
2/ :): 4/ 5/ 6/
0.01/
'~ : _/
.:'.- - _._.- .
I
.
' "
•
/ ,.
•
I
,.
,
I
,
,
0.27' / 19/
/
.:
:
"
,.
"
0.0 -
~Ull u . . . . N . . . ,".nu..ua.n.a:u ~" '(.-..h.:::-. . .... . ,.'
.0.2 - ;
" .
Jl
0
, ,
1Q
12
, ,
14
18
Cycle Number
1 =-...:;-_ =1
r =
-1 .00
Error:
0.0695
Inlercepl :41 .75
Slope: -3.284
..... ~ .. :o:. "': .. '!' . "': 3 :': .' ''': ' .. ,.-.. .. . "" ur""' "' 1
., . ---. .,, ---. ... - • .,. .. -... ...-, T' , .-, .. ,' -.. .. . "" " ... , "" ... c-r ~. ---. L2-• .,. .• -.. .,. .-~T' .-. "o
Log Conce nlration
hTR • Calculation:
Culcu lated
Cro. singpoint
Concentmtion (Cycle number)
I ) neg. con lrol h TR
2) Standard I (8.6 x 10· copies)
3) tandord 2 (5.8 x 10' copies)
4) Standard 3 (6,9 x 10' copies)
5) Standard 4 (6.1 x 10' copic.s)
6) Standard 5 (4.4 x 10' copies)
7) pos. control hTR
8) Sample hTR
9) nOl:o control PBOD
I 0) po,. con trol PBGD
I I)Sample PBOD
8.5 18.000
610.900
61.260
6.897
420.1
994.400
237,000
146.200
85.550
18.98
22.74
26,02
29.14
33. 13
22.05
24.09
24.78
25.55
rel.IITR expressioJl
SamplehTR _ 237,000 = 2.77
Slimple PBGD
85,550
1 +9
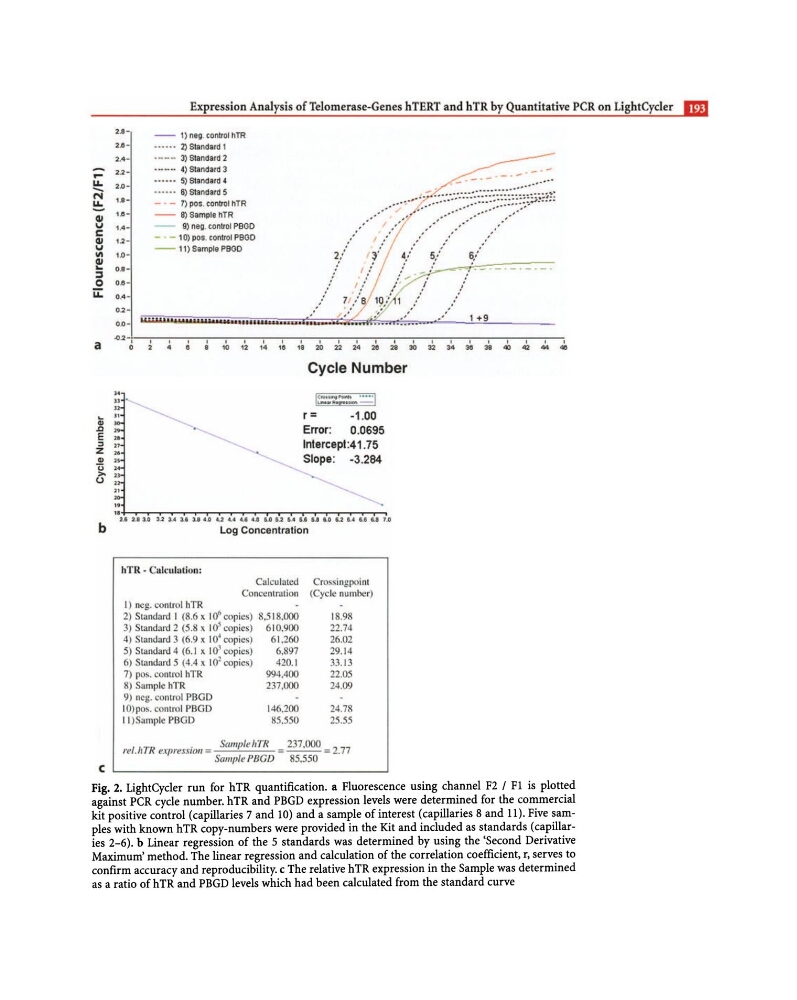
Fig. 2. LightCycler run for hTR quantification. a Fluorescence using channel F2 / Fl is plotted
against PCR cycle number. hTR and PBGD expression levels were determined for the commercial
kit positive control (capillaries 7 and 10) and a sample of interest (capillaries 8 and 11). Five samples with known hTR copy-numbers were provided in the Kit and included as standards (capillaries 2-6). b Linear regression of the 5 standards was determined by using the 'Second Derivative
Maximum' method. The linear regression and calculation of the correlation coefficient, r, serves to
confirm accuracy and reproducibility. c The relative hTR expression in the Sample was determined
as a ratio of hTR and PBGD levels which had been calculated from the standard curve
u..
-- I'll
u..
cu
..,
c:
cu
..,
III
CU
...
::I
0
u:::
a
~
.,
D
E
"
z
b
c
Expression Analysis of Telomerase-Genes hTERT and hTR by Quantitative pe R on LightCyd er mJ
2.8211 -
2.4 -
22 -
'.81 .81
1.2- - 1) neg. controt hTR
•• • •• • 2) Stan~.rd 1
. _-- 3) Sl.n~.rd 2
"'-" 4) SlaMard J
•••••• 5) Standard 4
• • ••• • 6) standard 5
- • - 7) po • . con~ol hTR
- - 8) Sample hTR
9) neg. tonkol PBOD
-
- 10) poe, conkol PBOD
- - 11) Sample PBOD
......•.. :.::: ... ~::~
2/ :): 4/ 5/ 6/
0.01/
'~ : _/
.:'.- - _._.- .
I
.
' "
•
/ ,.
•
I
,.
,
I
,
,
0.27' / 19/
/
.:
:
"
,.
"
0.0 -
~Ull u . . . . N . . . ,".nu..ua.n.a:u ~" '(.-..h.:::-. . .... . ,.'
.0.2 - ;
" .
Jl
0
, ,
1Q
12
, ,
14
18
Cycle Number
1 =-...:;-_ =1
r =
-1 .00
Error:
0.0695
Inlercepl :41 .75
Slope: -3.284
..... ~ .. :o:. "': .. '!' . "': 3 :': .' ''': ' .. ,.-.. .. . "" ur""' "' 1
., . ---. .,, ---. ... - • .,. .. -... ...-, T' , .-, .. ,' -.. .. . "" " ... , "" ... c-r ~. ---. L2-• .,. .• -.. .,. .-~T' .-. "o
Log Conce nlration
hTR • Calculation:
Culcu lated
Cro. singpoint
Concentmtion (Cycle number)
I ) neg. con lrol h TR
2) Standard I (8.6 x 10· copies)
3) tandord 2 (5.8 x 10' copies)
4) Standard 3 (6,9 x 10' copies)
5) Standard 4 (6.1 x 10' copic.s)
6) Standard 5 (4.4 x 10' copies)
7) pos. control hTR
8) Sample hTR
9) nOl:o control PBOD
I 0) po,. con trol PBGD
I I)Sample PBOD
8.5 18.000
610.900
61.260
6.897
420.1
994.400
237,000
146.200
85.550
18.98
22.74
26,02
29.14
33. 13
22.05
24.09
24.78
25.55
rel.IITR expressioJl
SamplehTR _ 237,000 = 2.77
Slimple PBGD
85,550
1 +9
Fig. 2. LightCycler run for hTR quantification. a Fluorescence using channel F2 / Fl is plotted
against PCR cycle number. hTR and PBGD expression levels were determined for the commercial
kit positive control (capillaries 7 and 10) and a sample of interest (capillaries 8 and 11). Five samples with known hTR copy-numbers were provided in the Kit and included as standards (capillaries 2-6). b Linear regression of the 5 standards was determined by using the 'Second Derivative
Maximum' method. The linear regression and calculation of the correlation coefficient, r, serves to
confirm accuracy and reproducibility. c The relative hTR expression in the Sample was determined
as a ratio of hTR and PBGD levels which had been calculated from the standard curve