

I'm Applications in Oncology
u::
N
!::.
<11
... s: <11
...
'" ~ ::I
0
ii:
a
b
c
,~ -
.,u -
u0.4 -
0.1...
-0. 1- 1
"
"
"
"
•
1) neg. ~ntrol nTERT
2) Slarw:lIJd 1
l) 610 ...... 2
.)81 ....... 3
5)SUMW"
B)S1an .... S
1) pos.. contral nlERT
8) SIImiI. nTERT
!D) neg. conlrol P8GD
- - 10) POI , control peoo
-
t1)Simp1ePBOD
,
"
,
n:
14
11!1
,.
Cycle Number
r =
-1 .00
Error:
0.430
Intercept : 39.03
Slope : -3.106
UUUUUU"UUUUU~u~uU~uuuu~
Log Concentration
hTERT - Calculation:
Calculated Cro singpoint
Concentration (Cycle number)
1) neg. control hTERT
2) Standard I (1.2 x 10 6 copies) 1,388,000
19.95
3) Standard 2 (9.5 x 10 4 copies)
96,960
23.54
4) Standard 3 (9.2 x IlY copics)
7,246
27.04
5) Standard 4 (8.3 x 10 2 copies)
651.5
30.29
6) Standard 5 (1.3 x 10 2 copies)
178.1
32.04
7) pos. control hTERT
566.1
30.48
8) Sample hTERT
1,736
28.97
9) neg. control PBGD
10)pos. control PBGO
42,590
24.65
I I) Sample PBGO
84,540
23.73
Sample h TERT 1,736 = 2.1 *10->
reI. hTERT expression = SamplePBGD 84.540
,.
JO
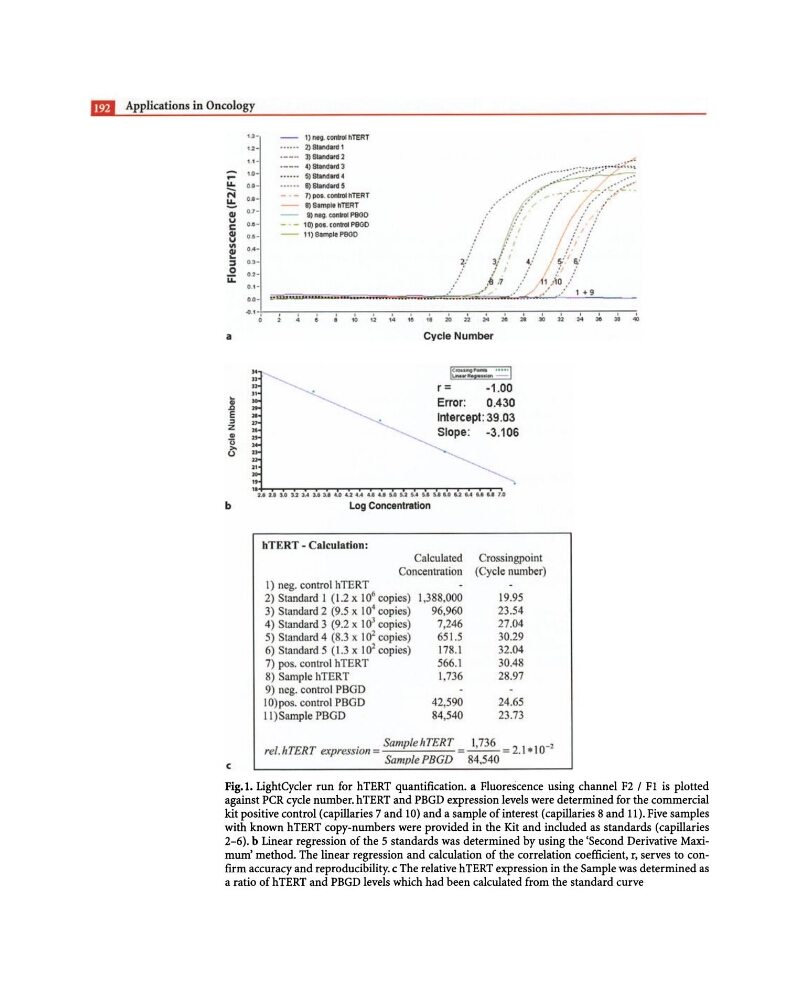
Fig. I. LightCycler run for hTERT quantification. a Fluorescence using channel F2 / Fl is plotted
against PCR cycle number. hTERT and PBGO expression levels were determined for the commercial
kit positive control (capillaries 7 and 10) and a sample of interest (capillaries 8 and 11). Five samples
with known hTERT copy-numbers were provided in the Kit and included as standards (capillaries
2-6). b Linear regression of the 5 standards was determined by using the 'Second Derivative Maximum' method. The linear regression and calculation of the correlation coefficient, r, serves to confirm accuracy and reproducibility. c The relative hTERT expression in the Sample was determined as
a ratio ofhTERT and PBGD levels which had been calculated from the standard curve
u::
N
!::.
<11
... s: <11
...
'" ~ ::I
0
ii:
a
b
c
,~ -
.,u -
u0.4 -
0.1...
-0. 1- 1
"
"
"
"
•
1) neg. ~ntrol nTERT
2) Slarw:lIJd 1
l) 610 ...... 2
.)81 ....... 3
5)SUMW"
B)S1an .... S
1) pos.. contral nlERT
8) SIImiI. nTERT
!D) neg. conlrol P8GD
- - 10) POI , control peoo
-
t1)Simp1ePBOD
,
"
,
n:
14
11!1
,.
Cycle Number
r =
-1 .00
Error:
0.430
Intercept : 39.03
Slope : -3.106
UUUUUU"UUUUU~u~uU~uuuu~
Log Concentration
hTERT - Calculation:
Calculated Cro singpoint
Concentration (Cycle number)
1) neg. control hTERT
2) Standard I (1.2 x 10 6 copies) 1,388,000
19.95
3) Standard 2 (9.5 x 10 4 copies)
96,960
23.54
4) Standard 3 (9.2 x IlY copics)
7,246
27.04
5) Standard 4 (8.3 x 10 2 copies)
651.5
30.29
6) Standard 5 (1.3 x 10 2 copies)
178.1
32.04
7) pos. control hTERT
566.1
30.48
8) Sample hTERT
1,736
28.97
9) neg. control PBGD
10)pos. control PBGO
42,590
24.65
I I) Sample PBGO
84,540
23.73
Sample h TERT 1,736 = 2.1 *10->
reI. hTERT expression = SamplePBGD 84.540
,.
JO
Fig. I. LightCycler run for hTERT quantification. a Fluorescence using channel F2 / Fl is plotted
against PCR cycle number. hTERT and PBGO expression levels were determined for the commercial
kit positive control (capillaries 7 and 10) and a sample of interest (capillaries 8 and 11). Five samples
with known hTERT copy-numbers were provided in the Kit and included as standards (capillaries
2-6). b Linear regression of the 5 standards was determined by using the 'Second Derivative Maximum' method. The linear regression and calculation of the correlation coefficient, r, serves to confirm accuracy and reproducibility. c The relative hTERT expression in the Sample was determined as
a ratio ofhTERT and PBGD levels which had been calculated from the standard curve