

mil Applications in Oncology
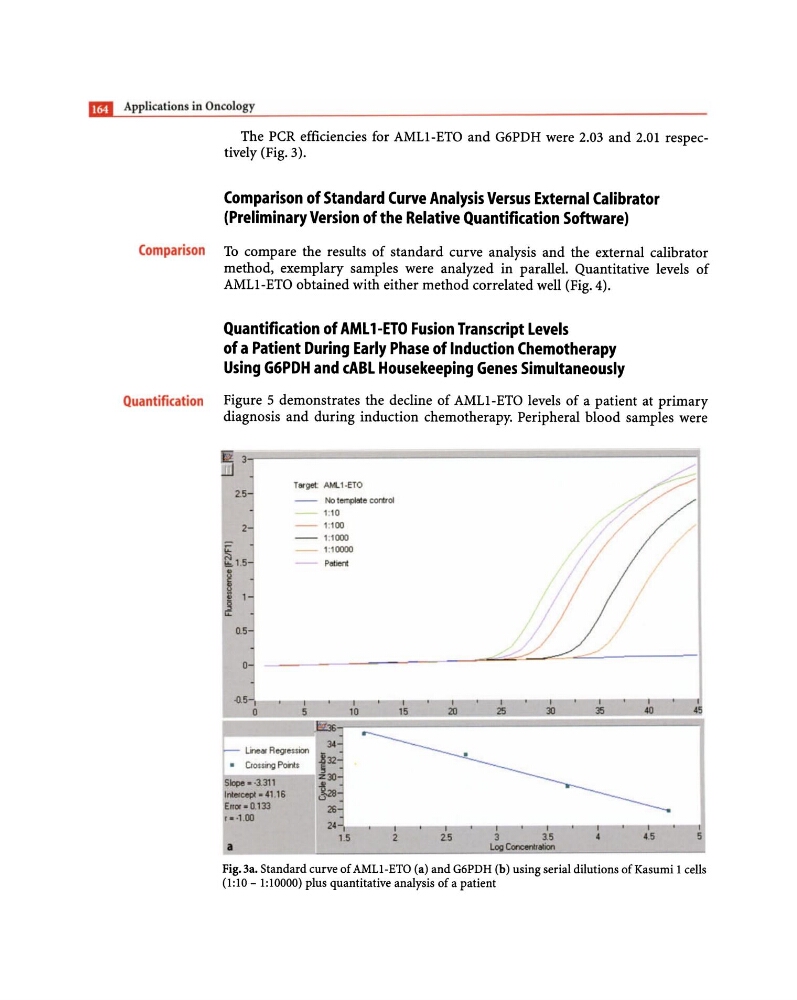
The peR efficiencies for AMLl-ETO and G6PDH were 2.03 and 2.01 respectively (Fig. 3).
Comparison of Standard Curve Analysis Versus External Calibrator
(Preliminary Version of the Relative Quantification Software)
Comparison To compare the results of standard curve analysis and the external calibrator
method, exemplary samples were analyzed in parallel. Quantitative levels of
AMLl-ETO obtained with either method correlated well (Fig. 4).
Quantification of AML l-ETO Fusion Transcript Levels
of a Patient During Early Phase of Induction Chemotherapy
Using G6PDH and cABL Housekeeping Genes Simultaneously
Quantification Figure 5 demonstrates the decline of AMLl-ETO levels of a patient at primary
diagnosis and during induction chemotherapy. Peripheral blood samples were
T "'Sjet AMl1-ETO
2.5
-
1'10 lempl!lte conIroi
1' 10
2
-
1.100
-
1:1000
~
_
1:10000
-
P..tienl
J '
0.5
o
.0.5 I
o
I
5
~ Un!41 Reg .... ion
• Cr=ing Pori •
Slape. ·3.311
InlercepC • 4116
E"",·Ol33
,. ·1.00
a
34
~32
zXl
~
26
I
10
24 I
15
I
2
I
15
I
20
2.5
I
25
I
3
1
Xl
I
3.5
Log Concenration
35
I
4
I
40
I
45
I
45
,
5
Fig.3a. Standard curve of AMLl-ETO (a) and G6PDH (b) using serial dilutions of Kasumi 1 cells
(1:10 - 1:10000) plus quantitative analysis of a patient
The peR efficiencies for AMLl-ETO and G6PDH were 2.03 and 2.01 respectively (Fig. 3).
Comparison of Standard Curve Analysis Versus External Calibrator
(Preliminary Version of the Relative Quantification Software)
Comparison To compare the results of standard curve analysis and the external calibrator
method, exemplary samples were analyzed in parallel. Quantitative levels of
AMLl-ETO obtained with either method correlated well (Fig. 4).
Quantification of AML l-ETO Fusion Transcript Levels
of a Patient During Early Phase of Induction Chemotherapy
Using G6PDH and cABL Housekeeping Genes Simultaneously
Quantification Figure 5 demonstrates the decline of AMLl-ETO levels of a patient at primary
diagnosis and during induction chemotherapy. Peripheral blood samples were
T "'Sjet AMl1-ETO
2.5
-
1'10 lempl!lte conIroi
1' 10
2
-
1.100
-
1:1000
~
_
1:10000
-
P..tienl
J '
0.5
o
.0.5 I
o
I
5
~ Un!41 Reg .... ion
• Cr=ing Pori •
Slape. ·3.311
InlercepC • 4116
E"",·Ol33
,. ·1.00
a
34
~32
zXl
~
26
I
10
24 I
15
I
2
I
15
I
20
2.5
I
25
I
3
1
Xl
I
3.5
Log Concenration
35
I
4
I
40
I
45
I
45
,
5
Fig.3a. Standard curve of AMLl-ETO (a) and G6PDH (b) using serial dilutions of Kasumi 1 cells
(1:10 - 1:10000) plus quantitative analysis of a patient