

0.511 -
f0,40 -
'0
-,-...
N
0.30 .
~
i'
ell
0.20 •
U
C
~
U
0.10 -
'" ell
1-0
0
~
0,00 -
Ei:
Genotyping of the Methionine-Valine Polymorphism at Codon 129 of the Human Prion Protein 1m
/ +
/--- 4
_
.\
/, -. .. ~ .. . . . .
/ ,
:
.
ell ••••
'''~ \
. . / ~-... . ' ' .: .
• .III
,.
•
_
. .... ..
I" 6 .. ~ .~ \~ .' ' .J'''' -;1": : , .
; , . .-0-.... .<~..,., .... \~\
~ ""..
"'.
' ~ , , .# •• '
"'\\\.
. . " _o~ _ _ :.:::::::;: . : 10 ,.0
\~
70
Temperature (OC)
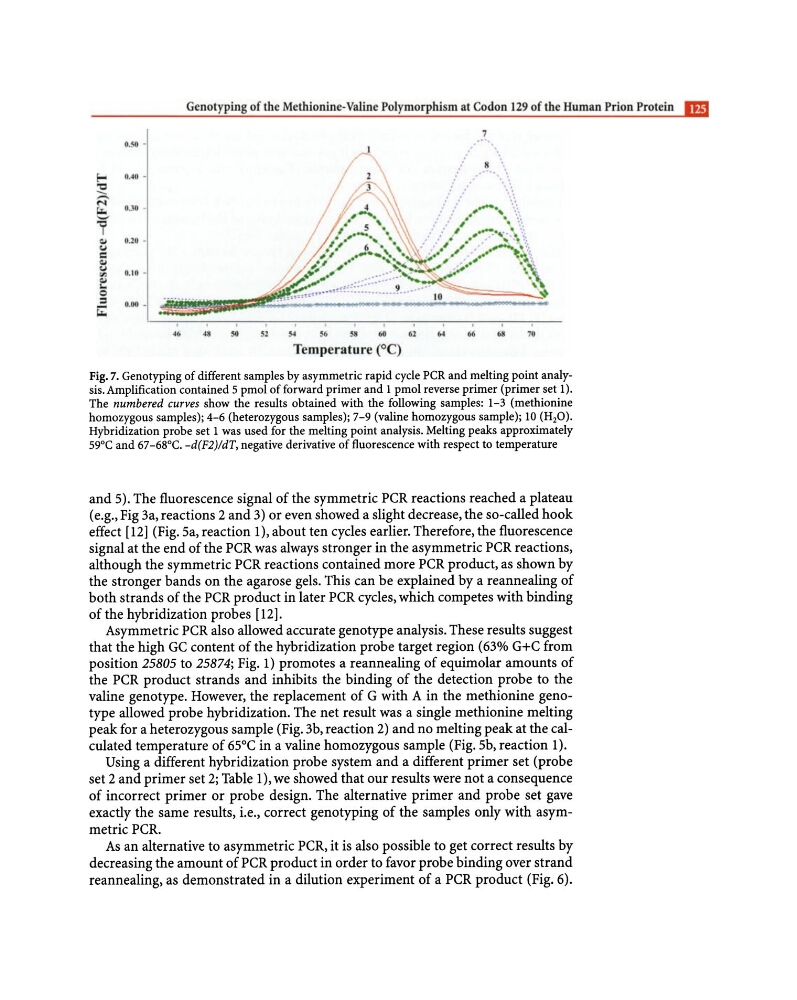
Fig. 7. Genotyping of different samples by asymmetric rapid cycle PCR and melting point analysis. Amplification contained 5 pmol of forward primer and 1 pmol reverse primer (primer set I),
The numbered curves show the results obtained with the following samples: 1-3 (methionine
homozygous samples); 4-6 (heterozygous samples); 7-9 (valine homozygous sample); 10 (H20).
Hybridization probe set 1 was used for the melting point analysis. Melting peaks approximately
59°C and 67 -68°C, -d(F2)1dT, negative derivative of fluorescence with respect to temperature
and 5). The fluorescence signal of the symmetric PCR reactions reached a plateau
(e.g., Fig 3a, reactions 2 and 3) or even showed a slight decrease, the so-called hook
effect [12] (Fig. Sa, reaction 1), about ten cycles earlier. Therefore, the fluorescence
signal at the end of the PCR was always stronger in the asymmetric PCR reactions,
although the symmetric PCR reactions contained more PCR product, as shown by
the stronger bands on the agarose gels. This can be explained by a reannealing of
both strands of the PCR product in later PCR cycles, which competes with binding
of the hybridization probes [12].
Asymmetric PCR also allowed accurate genotype analysis. These results suggest
that the high GC content of the hybridization probe target region (63% G+C from
position 25805 to 25874; Fig. 1) promotes a reannealing of equimolar amounts of
the PCR product strands and inhibits the binding of the detection probe to the
valine genotype. However, the replacement of G with A in the methionine genotype allowed probe hybridization. The net result was a single methionine melting
peak for a heterozygous sample (Fig. 3b, reaction 2) and no melting peak at the calculated temperature of 65°C in a valine homozygous sample (Fig. Sb, reaction 1).
Using a different hybridization probe system and a different primer set (probe
set 2 and primer set 2; Table 1), we showed that our results were not a consequence
of incorrect primer or probe design. The alternative primer and probe set gave
exactly the same results, i.e., correct genotyping of the samples only with asymmetric PCR.
As an alternative to asymmetric PCR, it is also possible to get correct results by
decreasing the amount of PCR product in order to favor probe binding over strand
reannealing, as demonstrated in a dilution experiment of a PCR product (Fig. 6).
f0,40 -
'0
-,-...
N
0.30 .
~
i'
ell
0.20 •
U
C
~
U
0.10 -
'" ell
1-0
0
~
0,00 -
Ei:
Genotyping of the Methionine-Valine Polymorphism at Codon 129 of the Human Prion Protein 1m
/ +
/--- 4
_
.\
/, -. .. ~ .. . . . .
/ ,
:
.
ell ••••
'''~ \
. . / ~-... . ' ' .: .
• .III
,.
•
_
. .... ..
I" 6 .. ~ .~ \~ .' ' .J'''' -;1": : , .
; , . .-0-.... .<~..,., .... \~\
~ ""..
"'.
' ~ , , .# •• '
"'\\\.
. . " _o~ _ _ :.:::::::;: . : 10 ,.0
\~
70
Temperature (OC)
Fig. 7. Genotyping of different samples by asymmetric rapid cycle PCR and melting point analysis. Amplification contained 5 pmol of forward primer and 1 pmol reverse primer (primer set I),
The numbered curves show the results obtained with the following samples: 1-3 (methionine
homozygous samples); 4-6 (heterozygous samples); 7-9 (valine homozygous sample); 10 (H20).
Hybridization probe set 1 was used for the melting point analysis. Melting peaks approximately
59°C and 67 -68°C, -d(F2)1dT, negative derivative of fluorescence with respect to temperature
and 5). The fluorescence signal of the symmetric PCR reactions reached a plateau
(e.g., Fig 3a, reactions 2 and 3) or even showed a slight decrease, the so-called hook
effect [12] (Fig. Sa, reaction 1), about ten cycles earlier. Therefore, the fluorescence
signal at the end of the PCR was always stronger in the asymmetric PCR reactions,
although the symmetric PCR reactions contained more PCR product, as shown by
the stronger bands on the agarose gels. This can be explained by a reannealing of
both strands of the PCR product in later PCR cycles, which competes with binding
of the hybridization probes [12].
Asymmetric PCR also allowed accurate genotype analysis. These results suggest
that the high GC content of the hybridization probe target region (63% G+C from
position 25805 to 25874; Fig. 1) promotes a reannealing of equimolar amounts of
the PCR product strands and inhibits the binding of the detection probe to the
valine genotype. However, the replacement of G with A in the methionine genotype allowed probe hybridization. The net result was a single methionine melting
peak for a heterozygous sample (Fig. 3b, reaction 2) and no melting peak at the calculated temperature of 65°C in a valine homozygous sample (Fig. Sb, reaction 1).
Using a different hybridization probe system and a different primer set (probe
set 2 and primer set 2; Table 1), we showed that our results were not a consequence
of incorrect primer or probe design. The alternative primer and probe set gave
exactly the same results, i.e., correct genotyping of the samples only with asymmetric PCR.
As an alternative to asymmetric PCR, it is also possible to get correct results by
decreasing the amount of PCR product in order to favor probe binding over strand
reannealing, as demonstrated in a dilution experiment of a PCR product (Fig. 6).