

Rapid Genotyping of 2-bp and 9-bp Deletion Mutations Using the LightCyclcr Instrument no
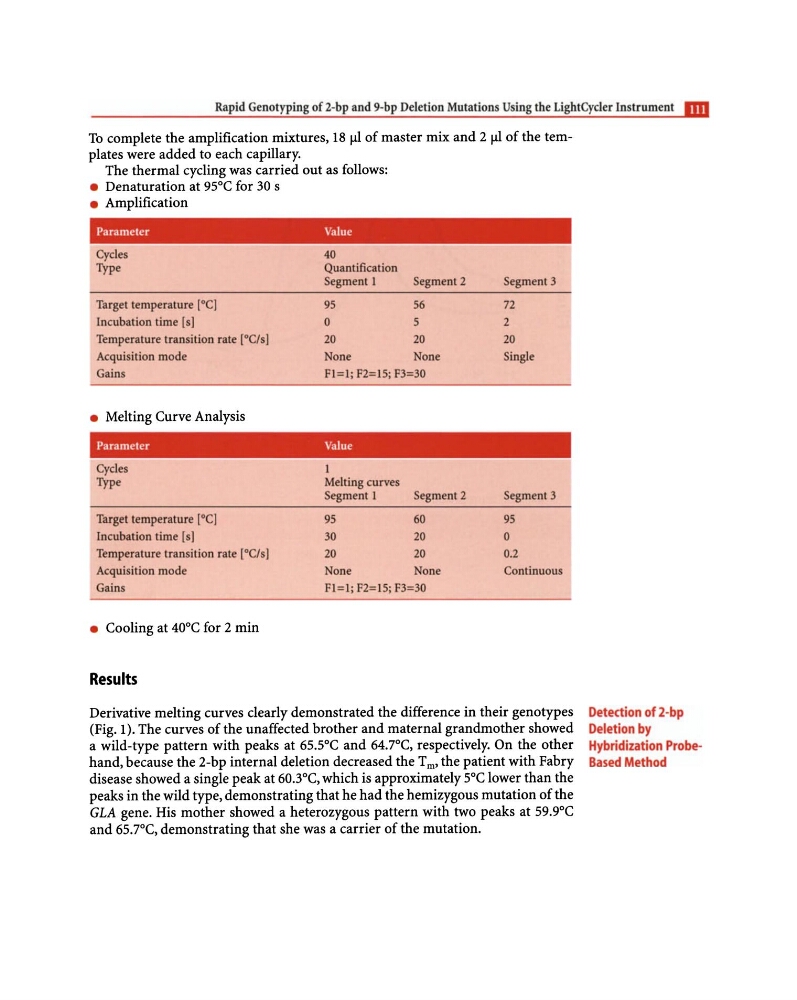
To complete the amplification mixtures, 18 fJl of master mix and 2 fJl of the templates were added to each capillary.
The thermal cycling was carried out as follows:
• Denaturation at 9S0C for 30 s
• Amplification
Parameter
Value
Cycles
Type
Target temperature [0C)
Incubation time [s)
Temperature transition rate [O C/s)
Acquisition mode
40
Quantification
Segment I
95
0
20
None
Segment 2
56
5
20
None
Gains
FI=I; F2=15; F3=30
• Melting Curve Analysis
Parameter
Value
Cycles
Type
Target temperature [0C)
Incubation time [s]
Temperature transition rate [OCls)
Acquisition mode
Gains
• Cooling at 40°C for 2 min
Results
Melting curves
Segment I
Segment 2
95
60
30
20
20
20
None
None
FI = I;F2= 15;F3=30
Segment 3
72
2
20
Single
Segment 3
95
0
0.2
Continuous
Derivative melting curves clearly demonstrated the difference in their genotypes
(Fig. 1). The curves of the unaffected brother and maternal grandmother showed
a wild-type pattern with peaks at 6S's°C and 64.7°C, respectively. On the other
hand, because the 2-bp internal deletion decreased the Tm, the patient with Fabry
disease showed a single peak at 60.3°C, which is approximately SOC lower than the
peaks in the wild type, demonstrating that he had the hemizygous mutation of the
GLA gene. His mother showed a heterozygous pattern with two peaks at S9.9°C
and 65.7°C, demonstrating that she was a carrier of the mutation.
Detection of 2-bp
Deletion by
Hybridization ProbeBased Method
To complete the amplification mixtures, 18 fJl of master mix and 2 fJl of the templates were added to each capillary.
The thermal cycling was carried out as follows:
• Denaturation at 9S0C for 30 s
• Amplification
Parameter
Value
Cycles
Type
Target temperature [0C)
Incubation time [s)
Temperature transition rate [O C/s)
Acquisition mode
40
Quantification
Segment I
95
0
20
None
Segment 2
56
5
20
None
Gains
FI=I; F2=15; F3=30
• Melting Curve Analysis
Parameter
Value
Cycles
Type
Target temperature [0C)
Incubation time [s]
Temperature transition rate [OCls)
Acquisition mode
Gains
• Cooling at 40°C for 2 min
Results
Melting curves
Segment I
Segment 2
95
60
30
20
20
20
None
None
FI = I;F2= 15;F3=30
Segment 3
72
2
20
Single
Segment 3
95
0
0.2
Continuous
Derivative melting curves clearly demonstrated the difference in their genotypes
(Fig. 1). The curves of the unaffected brother and maternal grandmother showed
a wild-type pattern with peaks at 6S's°C and 64.7°C, respectively. On the other
hand, because the 2-bp internal deletion decreased the Tm, the patient with Fabry
disease showed a single peak at 60.3°C, which is approximately SOC lower than the
peaks in the wild type, demonstrating that he had the hemizygous mutation of the
GLA gene. His mother showed a heterozygous pattern with two peaks at S9.9°C
and 65.7°C, demonstrating that she was a carrier of the mutation.
Detection of 2-bp
Deletion by
Hybridization ProbeBased Method