

490
K. M. G. Mostofa et al.
component (T UV -like) is refractory to photoinduced degradation but it is labile to
microbial degradation (Mostofa et al. 2010). The form and composition of detergents is variable and recently includes synthetic or naturally occurring polymers
with molecular weight ranging from <1000 to >1,000,000 Da (McCullen 1996).
Surfactants can have different functionalities (anionic, nonionic and cationic) and
commonly used commercial ones are linear alkylbenzene sulphonates, alkyl ethoxy sulphates, alkyl sulphates, alkylphenol ethoxylates, akyl ethoxylates, and quaternary ammonium compounds (McCullen 1996; Ying 2006).
Algae or Phytoplankton
Algae or phytoplankton show several peaks such as 280–285/340–346 nm at peak
T-region and 230/327–346 or 230/305 nm at peak T UV -region when resuspended in
water (Tables 1, 2) (Mostofa KMG et al., unpublished data; Determann et al. 1998).
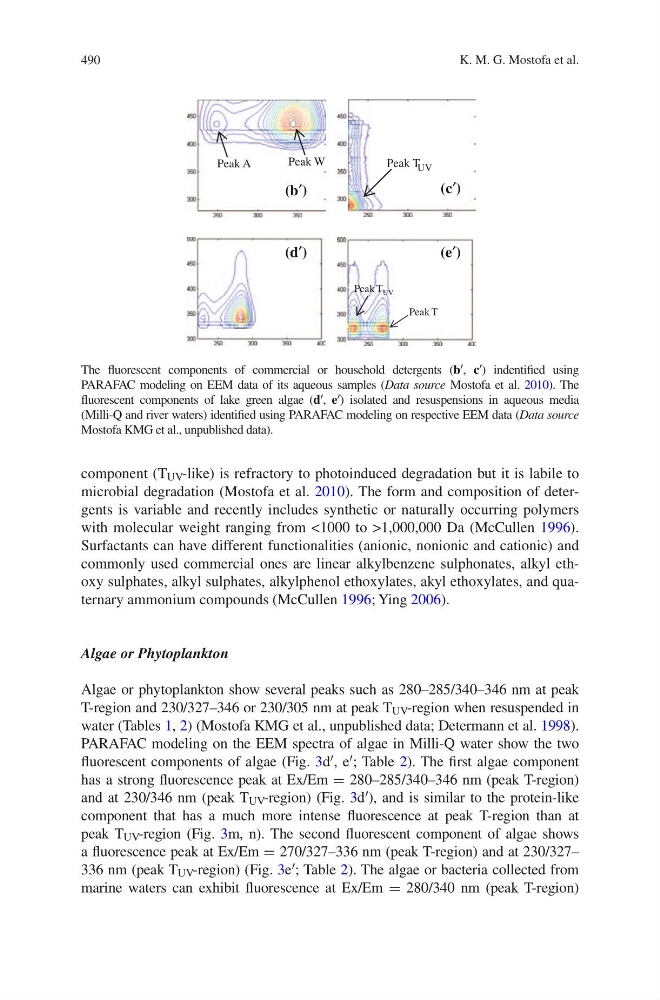
PARAFAC modeling on the EEM spectra of algae in Milli-Q water show the two
fluorescent components of algae (Fig. 3d′, e′; Table 2). The first algae component
has a strong fluorescence peak at Ex/Em = 280–285/340–346 nm (peak T-region)
and at 230/346 nm (peak T UV -region) (Fig. 3d′), and is similar to the protein-like
component that has a much more intense fluorescence at peak T-region than at
peak T UV -region (Fig. 3m, n). The second fluorescent component of algae shows
a fluorescence peak at Ex/Em = 270/327–336 nm (peak T-region) and at 230/327–
336 nm (peak T UV -region) (Fig. 3e′; Table 2). The algae or bacteria collected from
marine waters can exhibit fluorescence at Ex/Em = 280/340 nm (peak T-region)
(a′)
(b′)
(c′)
Peak W
Peak A
Peak T UV
Peak T
Peak T UV
(d′)
( e′)
The fluorescent components of commercial or household detergents (b′, c′) indentified using
PARAFAC modeling on EEM data of its aqueous samples (Data source Mostofa et al. 2010). The
fluorescent components of lake green algae (d′, e′) isolated and resuspensions in aqueous media
(Milli-Q and river waters) identified using PARAFAC modeling on respective EEM data (Data source
Mostofa KMG et al., unpublished data).
K. M. G. Mostofa et al.
component (T UV -like) is refractory to photoinduced degradation but it is labile to
microbial degradation (Mostofa et al. 2010). The form and composition of detergents is variable and recently includes synthetic or naturally occurring polymers
with molecular weight ranging from <1000 to >1,000,000 Da (McCullen 1996).
Surfactants can have different functionalities (anionic, nonionic and cationic) and
commonly used commercial ones are linear alkylbenzene sulphonates, alkyl ethoxy sulphates, alkyl sulphates, alkylphenol ethoxylates, akyl ethoxylates, and quaternary ammonium compounds (McCullen 1996; Ying 2006).
Algae or Phytoplankton
Algae or phytoplankton show several peaks such as 280–285/340–346 nm at peak
T-region and 230/327–346 or 230/305 nm at peak T UV -region when resuspended in
water (Tables 1, 2) (Mostofa KMG et al., unpublished data; Determann et al. 1998).
PARAFAC modeling on the EEM spectra of algae in Milli-Q water show the two
fluorescent components of algae (Fig. 3d′, e′; Table 2). The first algae component
has a strong fluorescence peak at Ex/Em = 280–285/340–346 nm (peak T-region)
and at 230/346 nm (peak T UV -region) (Fig. 3d′), and is similar to the protein-like
component that has a much more intense fluorescence at peak T-region than at
peak T UV -region (Fig. 3m, n). The second fluorescent component of algae shows
a fluorescence peak at Ex/Em = 270/327–336 nm (peak T-region) and at 230/327–
336 nm (peak T UV -region) (Fig. 3e′; Table 2). The algae or bacteria collected from
marine waters can exhibit fluorescence at Ex/Em = 280/340 nm (peak T-region)
(a′)
(b′)
(c′)
Peak W
Peak A
Peak T UV
Peak T
Peak T UV
(d′)
( e′)
The fluorescent components of commercial or household detergents (b′, c′) indentified using
PARAFAC modeling on EEM data of its aqueous samples (Data source Mostofa et al. 2010). The
fluorescent components of lake green algae (d′, e′) isolated and resuspensions in aqueous media
(Milli-Q and river waters) identified using PARAFAC modeling on respective EEM data (Data source
Mostofa KMG et al., unpublished data).