

3. Irradiance and Lipid Production
63
40
•
c
•
0
U :::l
"0 30
e
•
a.
•
Ol
•
~
••••
• •
« 20 •
• •
'0
•
• •
• I • 'til
• •
• .. , •
"0
: . •
"6. 10
••
::J
•
• •
100
200
300
Day of the Year
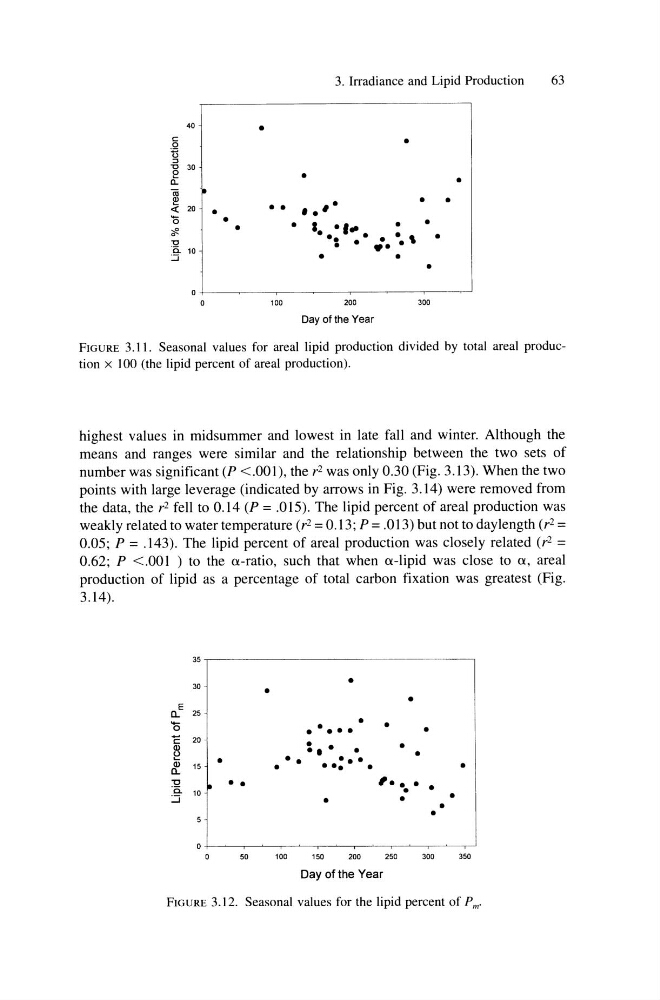
FIGURE 3.11. Seasonal values for areal lipid production divided by total areal production x 100 (the lipid percent of areal production).
highest values in midsummer and lowest in late fall and winter. Although the
means and ranges were similar and the relationship between the two sets of
number was significant (P <.001), the r2 was only 0.30 (Fig. 3.13). When the two
points with large leverage (indicated by arrows in Fig. 3.14) were removed from
the data, the r2 fell to 0.14 (P = .015). The lipid percent of areal production was
weakly related to water temperature (r 2 = 0.13; P = .013) but not to day length (r 2 =
0.05; P = .143). The lipid percent of areal production was closely related (r 2 =
0.62; P <.001 ) to the a-ratio, such that when a-lipid was close to a, areal
production of lipid as a percentage of total carbon fixation was greatest (Fig.
3.14).
35
•
30
•
•
E
0.. 25
'0
• •
• • •••
•
"E 20
: ..
Q)
•
•
~
•
•
• •
• ••
Q)
15
•
· -. .
•
0..
"C
10 ~ • •
, .. •
'0.
• •
:.:J
•
•
•
•
•
50
100
150
200
250
300
350
Day of the Year
FIGURE 3.12. Seasonal values for the lipid percent of Pm'
63
40
•
c
•
0
U :::l
"0 30
e
•
a.
•
Ol
•
~
••••
• •
« 20 •
• •
'0
•
• •
• I • 'til
• •
• .. , •
"0
: . •
"6. 10
••
::J
•
• •
100
200
300
Day of the Year
FIGURE 3.11. Seasonal values for areal lipid production divided by total areal production x 100 (the lipid percent of areal production).
highest values in midsummer and lowest in late fall and winter. Although the
means and ranges were similar and the relationship between the two sets of
number was significant (P <.001), the r2 was only 0.30 (Fig. 3.13). When the two
points with large leverage (indicated by arrows in Fig. 3.14) were removed from
the data, the r2 fell to 0.14 (P = .015). The lipid percent of areal production was
weakly related to water temperature (r 2 = 0.13; P = .013) but not to day length (r 2 =
0.05; P = .143). The lipid percent of areal production was closely related (r 2 =
0.62; P <.001 ) to the a-ratio, such that when a-lipid was close to a, areal
production of lipid as a percentage of total carbon fixation was greatest (Fig.
3.14).
35
•
30
•
•
E
0.. 25
'0
• •
• • •••
•
"E 20
: ..
Q)
•
•
~
•
•
• •
• ••
Q)
15
•
· -. .
•
0..
"C
10 ~ • •
, .. •
'0.
• •
:.:J
•
•
•
•
•
50
100
150
200
250
300
350
Day of the Year
FIGURE 3.12. Seasonal values for the lipid percent of Pm'