

62
B.C. Wainman et al.
1 6 - , - - - - - - - - - -
a a-lipid = O.64(daylength) - 1.52
14
~= 0.25
• •
Daylength (h)
•
18
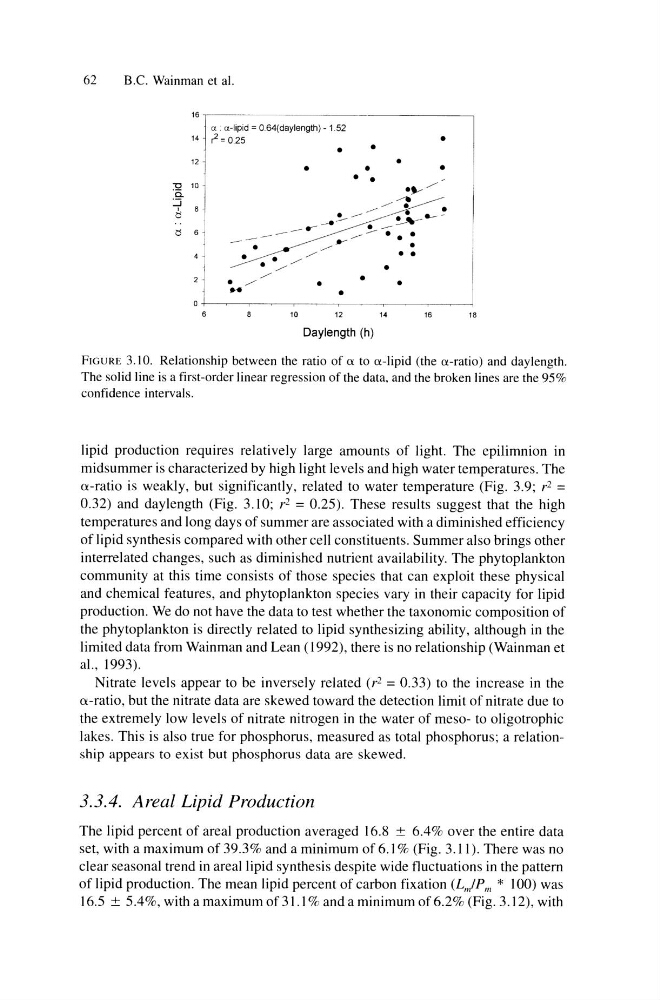
FIGURE 3.10. Relationship between the ratio of a to a-lipid (the a-ratio) and daylength.
The solid line is a first-order linear regression of the data, and the broken lines are the 95%
confidence intervals.
lipid production requires relatively large amounts of light. The epilimnion in
midsummer is characterized by high light levels and high water temperatures. The
a-ratio is weakly, but significantly, related to water temperature (Fig. 3.9; r2 =
0.32) and day length (Fig. 3.10; r2 = 0.25). These results suggest that the high
temperatures and long days of summer are associated with a diminished efficiency
of lipid synthesis compared with other cell constituents. Summer also brings other
interrelated changes, such as diminished nutrient availability. The phytoplankton
community at this time consists of those species that can exploit these physical
and chemical features, and phytoplankton species vary in their capacity for lipid
production. We do not have the data to test whether the taxonomic composition of
the phytoplankton is directly related to lipid synthesizing ability, although in the
limited data from Wainman and Lean (1992), there is no relationship (Wainman et
aI., 1993).
Nitrate levels appear to be inversely related (r2 = 0.33) to the increase in the
a-ratio, but the nitrate data are skewed toward the detection limit of nitrate due to
the extremely low levels of nitrate nitrogen in the water of meso- to oligotrophic
lakes. This is also true for phosphorus, measured as total phosphorus; a relationship appears to exist but phosphorus data are skewed.
3.3.4. Areal Lipid Production
The lipid percent of areal production averaged 16.8 ± 6.4% over the entire data
set, with a maximum of 39.3% and a minimum of 6.1 % (Fig. 3.11). There was no
clear seasonal trend in areal lipid synthesis despite wide fluctuations in the pattern
of lipid production. The mean lipid percent of carbon fixation (L,JP m * 100) was
16.5 ± 5.4%, with a maximum of 31.1 % and a minimum of 6.2% (Fig. 3.12), with
B.C. Wainman et al.
1 6 - , - - - - - - - - - -
a a-lipid = O.64(daylength) - 1.52
14
~= 0.25
• •
Daylength (h)
•
18
FIGURE 3.10. Relationship between the ratio of a to a-lipid (the a-ratio) and daylength.
The solid line is a first-order linear regression of the data, and the broken lines are the 95%
confidence intervals.
lipid production requires relatively large amounts of light. The epilimnion in
midsummer is characterized by high light levels and high water temperatures. The
a-ratio is weakly, but significantly, related to water temperature (Fig. 3.9; r2 =
0.32) and day length (Fig. 3.10; r2 = 0.25). These results suggest that the high
temperatures and long days of summer are associated with a diminished efficiency
of lipid synthesis compared with other cell constituents. Summer also brings other
interrelated changes, such as diminished nutrient availability. The phytoplankton
community at this time consists of those species that can exploit these physical
and chemical features, and phytoplankton species vary in their capacity for lipid
production. We do not have the data to test whether the taxonomic composition of
the phytoplankton is directly related to lipid synthesizing ability, although in the
limited data from Wainman and Lean (1992), there is no relationship (Wainman et
aI., 1993).
Nitrate levels appear to be inversely related (r2 = 0.33) to the increase in the
a-ratio, but the nitrate data are skewed toward the detection limit of nitrate due to
the extremely low levels of nitrate nitrogen in the water of meso- to oligotrophic
lakes. This is also true for phosphorus, measured as total phosphorus; a relationship appears to exist but phosphorus data are skewed.
3.3.4. Areal Lipid Production
The lipid percent of areal production averaged 16.8 ± 6.4% over the entire data
set, with a maximum of 39.3% and a minimum of 6.1 % (Fig. 3.11). There was no
clear seasonal trend in areal lipid synthesis despite wide fluctuations in the pattern
of lipid production. The mean lipid percent of carbon fixation (L,JP m * 100) was
16.5 ± 5.4%, with a maximum of 31.1 % and a minimum of 6.2% (Fig. 3.12), with