

3. Irradiance and Lipid Production
61
•
• •
•
•
• •
• •
•••
• •
o 6
•
•
•
•• "It
• •
• •
•• •
•
•
• •
• •
•
•
• •
•
• •
•
•
•
•
100
200
300
Day of the Year
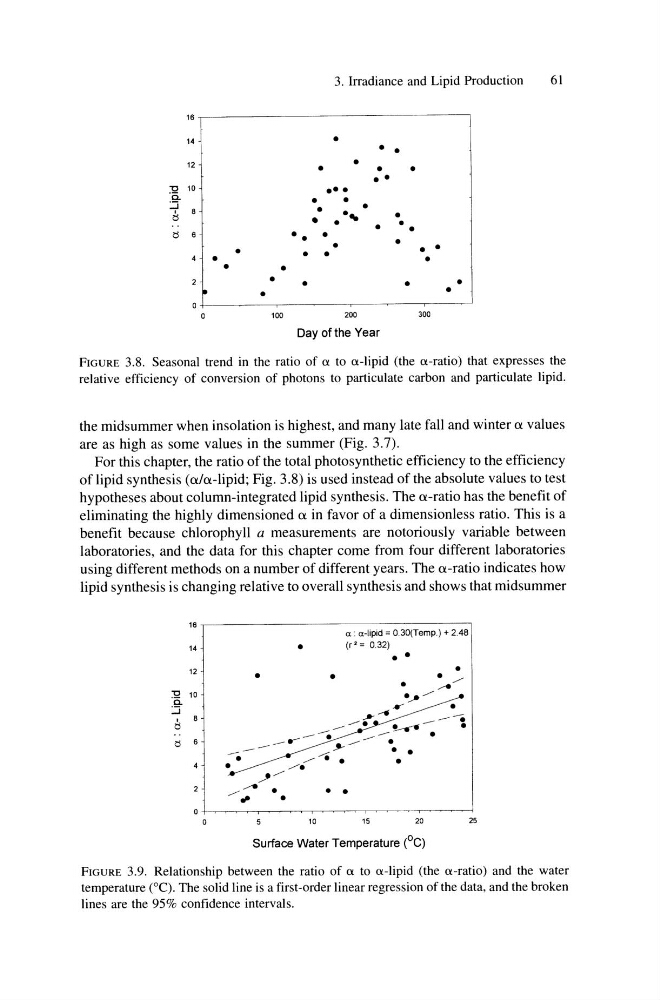
FIGURE 3.8. Seasonal trend in the ratio of a to a-lipid (the a-ratio) that expresses the
relative efficiency of conversion of photons to particulate carbon and particulate lipid.
the midsummer when insolation is highest, and many late fall and winter a values
are as high as some values in the summer (Fig. 3.7).
For this chapter, the ratio of the total photosynthetic efficiency to the efficiency
oflipid synthesis (a/a-lipid; Fig. 3.8) is used instead of the absolute values to test
hypotheses about column-integrated lipid synthesis. The a-ratio has the benefit of
eliminating the highly dimensioned a in favor of a dimensionless ratio. This is a
benefit because chlorophyll a measurements are notoriously variable between
laboratories, and the data for this chapter come from four different laboratories
using different methods on a number of different years. The a-ratio indicates how
lipid synthesis is changing relative to overall synthesis and shows that midsummer
16,------------------------------------,
14
12·
""C 10
'0.
:.J
b
•
•
•
10
a: a-lipid = 0.30(Temp.) + 2.48
(r' = 0.32) • •
•
•
---. •
15
20
25
Surface Water Temperature (0G)
FIGURE 3.9. Relationship between the ratio of a to a-lipid (the a-ratio) and the water
temperature (0C). The solid line is a first-order linear regression of the data, and the broken
lines are the 95% confidence intervals.
61
•
• •
•
•
• •
• •
•••
• •
o 6
•
•
•
•• "It
• •
• •
•• •
•
•
• •
• •
•
•
• •
•
• •
•
•
•
•
100
200
300
Day of the Year
FIGURE 3.8. Seasonal trend in the ratio of a to a-lipid (the a-ratio) that expresses the
relative efficiency of conversion of photons to particulate carbon and particulate lipid.
the midsummer when insolation is highest, and many late fall and winter a values
are as high as some values in the summer (Fig. 3.7).
For this chapter, the ratio of the total photosynthetic efficiency to the efficiency
oflipid synthesis (a/a-lipid; Fig. 3.8) is used instead of the absolute values to test
hypotheses about column-integrated lipid synthesis. The a-ratio has the benefit of
eliminating the highly dimensioned a in favor of a dimensionless ratio. This is a
benefit because chlorophyll a measurements are notoriously variable between
laboratories, and the data for this chapter come from four different laboratories
using different methods on a number of different years. The a-ratio indicates how
lipid synthesis is changing relative to overall synthesis and shows that midsummer
16,------------------------------------,
14
12·
""C 10
'0.
:.J
b
•
•
•
10
a: a-lipid = 0.30(Temp.) + 2.48
(r' = 0.32) • •
•
•
---. •
15
20
25
Surface Water Temperature (0G)
FIGURE 3.9. Relationship between the ratio of a to a-lipid (the a-ratio) and the water
temperature (0C). The solid line is a first-order linear regression of the data, and the broken
lines are the 95% confidence intervals.