

60
B.C. Wainman et al.
._-•
•
I
I k ' Ik-Lipid = -D. 18(daylength) + 3.66
,2 = 031. n = 47
•
•
•
•
i
oi~~~----~--~
6
8
10
12
14
16
18
Daylength (h)
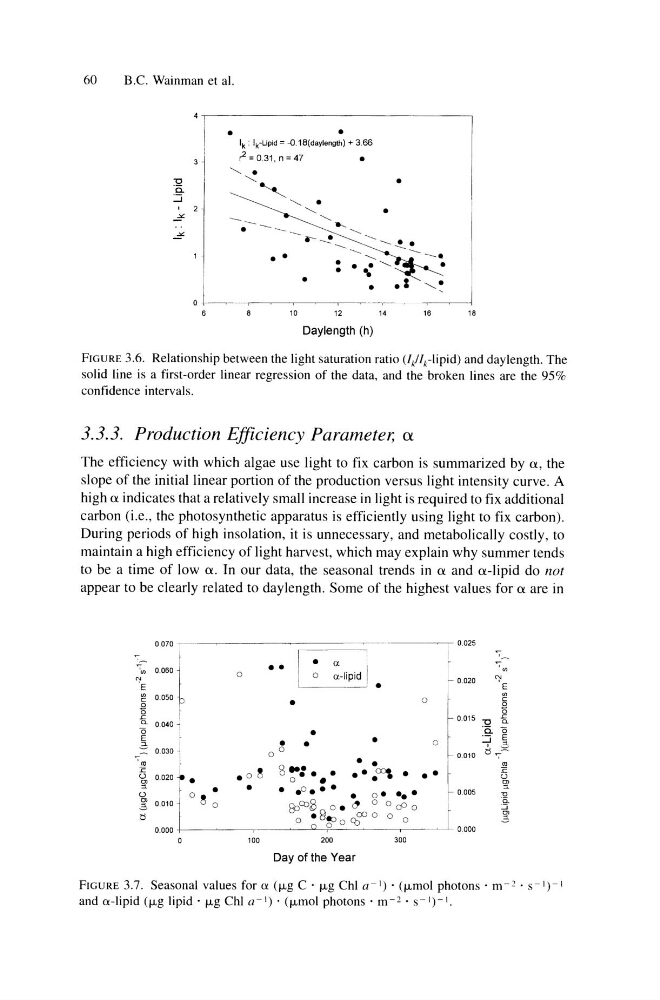
FIGURE 3.6. Relationship between the light saturation ratio (//Ik-lipid) and day length. The
solid line is a first -order linear regression of the data, and the broken lines are the 95%
confidence intervals.
3.3.3. Production Efficiency Parameter, a
The efficiency with which algae use light to fix carbon is summarized by a, the
slope of the initial linear portion of the production versus light intensity curve. A
high a indicates that a relatively small increase in light is required to fix additional
carbon (i.e., the photosynthetic apparatus is efficiently using light to fix carbon).
During periods of high insolation, it is unnecessary, and metabolically costly, to
maintain a high efficiency of light harvest, which may explain why summer tends
to be a time of Iowa. In our data, the seasonal trends in a and a-lipid do not
appear to be clearly related to day length. Some of the highest values for a are in
0.070
- ---~ .. -~----- -------,--- 0.025
U)
0.060
N
E
~ 0.050
g
o
r::
~ 0.040 I
~ 0.030 I
III
~ 0.020 t · .
()
, C e
~ 0.010 j C
0.000 -
o
100
o
•
o
•
•
•
•
f
r 0.020
"i ;
o
§
(5
~ 0.015 "0 -§.
8l 0010 ~ J
•
•
III
8":. • • •• ~. ••
is
o
•
~
• ~~~;~: ~cc ~.~ ~: f 0005 i
o 0
i
~o,ooo
200
300
Day of the Year
FIGURE 3.7. Seasonal values for a (fLg C . fLg Chi a -I) . (fLmol photons· m - 2 • S - I) - I
and a-lipid (fLg lipid' fLg Chi a-I) . (fLmol photons' m- 2 . S-I)-I.
B.C. Wainman et al.
._-•
•
I
I k ' Ik-Lipid = -D. 18(daylength) + 3.66
,2 = 031. n = 47
•
•
•
•
i
oi~~~----~--~
6
8
10
12
14
16
18
Daylength (h)
FIGURE 3.6. Relationship between the light saturation ratio (//Ik-lipid) and day length. The
solid line is a first -order linear regression of the data, and the broken lines are the 95%
confidence intervals.
3.3.3. Production Efficiency Parameter, a
The efficiency with which algae use light to fix carbon is summarized by a, the
slope of the initial linear portion of the production versus light intensity curve. A
high a indicates that a relatively small increase in light is required to fix additional
carbon (i.e., the photosynthetic apparatus is efficiently using light to fix carbon).
During periods of high insolation, it is unnecessary, and metabolically costly, to
maintain a high efficiency of light harvest, which may explain why summer tends
to be a time of Iowa. In our data, the seasonal trends in a and a-lipid do not
appear to be clearly related to day length. Some of the highest values for a are in
0.070
- ---~ .. -~----- -------,--- 0.025
U)
0.060
N
E
~ 0.050
g
o
r::
~ 0.040 I
~ 0.030 I
III
~ 0.020 t · .
()
, C e
~ 0.010 j C
0.000 -
o
100
o
•
o
•
•
•
•
f
r 0.020
"i ;
o
§
(5
~ 0.015 "0 -§.
8l 0010 ~ J
•
•
III
8":. • • •• ~. ••
is
o
•
~
• ~~~;~: ~cc ~.~ ~: f 0005 i
o 0
i
~o,ooo
200
300
Day of the Year
FIGURE 3.7. Seasonal values for a (fLg C . fLg Chi a -I) . (fLmol photons· m - 2 • S - I) - I
and a-lipid (fLg lipid' fLg Chi a-I) . (fLmol photons' m- 2 . S-I)-I.