

50
B.C. Wainman et al.
3.2.2. Diel Versus Light-Phase Allocation and Synthesis
Photosynthetic light responses and allocation patterns at the end of the light phase
varied through the observation period in Georgian Bay, and a full analysis of the
relationship of such responses to environmental variations is given elsewhere
(Furgal et aI., 1998; Furgal and Smith, 1997). The seasonal average allocation
0
. .
cu
a::
....
t:
N
I4 ~---------------------~
2
o
4
2 -
1 ~
oj
I
-1 I
8 -j
I
4 -
~ -I
0/~
I
/
CJ)- - ~ffi- .c.... ~ e -- - -@- -- -Cf Neutral Lipid
Poly
1:1
I
---. . . - - - - -~·~------A--------J
t- _. _.T _. _____ .... __ ____ ~ *-- _- .. _ ". / / Lipid
t ·r---'l
-1 - - - - - - - - ,------- ._,- .... ,-- -'-.
-r-- -,,-,.,,--- ----~~
0
N
0
N
C"l
;:!:
'
i.
N
:>
OJ
::;
>c,
i.
t
0
c
...,
::;
:::J
OJ
Z
:::J
(J)
OJ
0
...,
...,
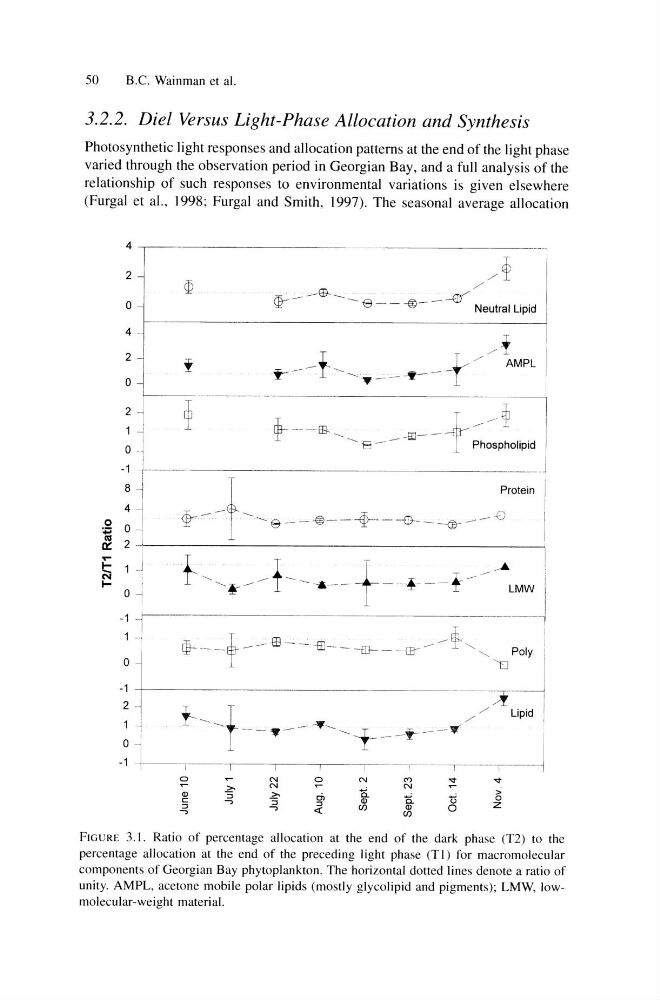
FIGURE 3.1. Ratio of percentage allocation at the end of the dark phase (T2) to the
percentage allocation at the end of the preceding light phase (T I) for macromolecular
components of Georgian Bay phytoplankton. The horizontal dotted lines denote a ratio of
unity. AMPL, acetone mobile polar lipids (mostly glycolipid and pigments); LMW, lowmolecular-weight material.
B.C. Wainman et al.
3.2.2. Diel Versus Light-Phase Allocation and Synthesis
Photosynthetic light responses and allocation patterns at the end of the light phase
varied through the observation period in Georgian Bay, and a full analysis of the
relationship of such responses to environmental variations is given elsewhere
(Furgal et aI., 1998; Furgal and Smith, 1997). The seasonal average allocation
0
. .
cu
a::
....
t:
N
I4 ~---------------------~
2
o
4
2 -
1 ~
oj
I
-1 I
8 -j
I
4 -
~ -I
0/~
I
/
CJ)- - ~ffi- .c.... ~ e -- - -@- -- -Cf Neutral Lipid
Poly
1:1
I
---. . . - - - - -~·~------A--------J
t- _. _.T _. _____ .... __ ____ ~ *-- _- .. _ ". / / Lipid
t ·r---'l
-1 - - - - - - - - ,------- ._,- .... ,-- -'-.
-r-- -,,-,.,,--- ----~~
0
N
0
N
C"l
;:!:
'
i.
N
:>
OJ
::;
>c,
i.
t
0
c
...,
::;
:::J
OJ
Z
:::J
(J)
OJ
0
...,
...,
FIGURE 3.1. Ratio of percentage allocation at the end of the dark phase (T2) to the
percentage allocation at the end of the preceding light phase (T I) for macromolecular
components of Georgian Bay phytoplankton. The horizontal dotted lines denote a ratio of
unity. AMPL, acetone mobile polar lipids (mostly glycolipid and pigments); LMW, lowmolecular-weight material.