

3. Irradiance and Lipid Production
49
first step was an extraction in 2: 1 chloroforrn:methanol, followed by separation of
the alcohol fraction (containing LMW) and the chloroform fraction (containing
lipids). The insoluble residue from the first extraction step was then extracted in
hot 5% trichloroacetic acid to solubilize polysaccharides, leaving proteins as the
final insoluble residue. The total lipid extract was subsequently separated into
three major lipid classes, neutral, glyco-, and phospholipids, by silica gel chromatography (Smith and D'Souza, 1993).
Environmental variables monitored through the sampling period included soluble reactive silicate (SRSi) and phosphate, representing the two nutrients most
likely to be limiting for phytoplankton growth in Georgian Bay (Furgal and Smith,
1997; Munawar, 1988). Phosphorus limitation was additionally assessed by the
phosphorus deficiency index (PDI) (Lean and Pick, 1981), which uses the ratio of
P-saturated P uptake rate to light-saturated C uptake rate to characterize P deficiency. A PDr < 10 indicates severe deficiency and a PDr <50 indicates moderate
deficiency; higher values indicate slight or no deficiency. The light adaptation
parameter I k , which estimates the irradiance at which light saturation of total
photosynthesis sets in (Kirk, 1983), was calculated from the observed photosynthesis-irradiance responses to characterize the photoadaptive state of the
phytoplankton.
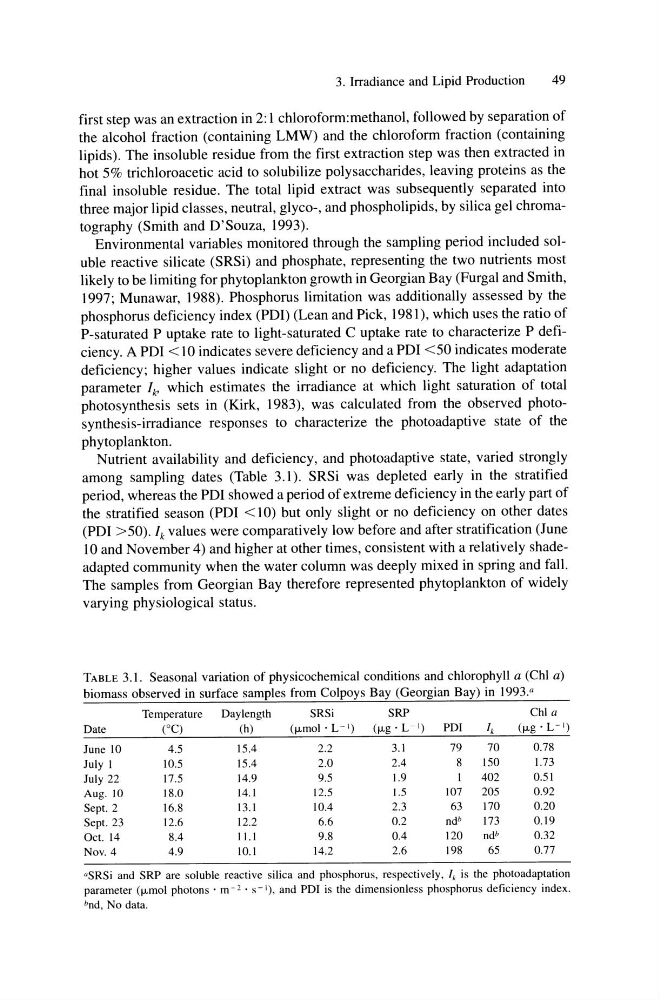
Nutrient availability and deficiency, and photoadaptive state, varied strongly
among sampling dates (Table 3.1). SRSi was depleted early in the stratified
period, whereas the PDr showed a period of extreme deficiency in the early part of
the stratified season (PDr < 10) but only slight or no deficiency on other dates
(PDr >50). Ik values were comparatively low before and after stratification (June
10 and November 4) and higher at other times, consistent with a relatively shadeadapted community when the water column was deeply mixed in spring and fall.
The samples from Georgian Bay therefore represented phytoplankton of widely
varying physiological status.
TABLE 3.1. Seasonal variation of physicochemical conditions and chlorophyll a (ChI a)
biomass observed in surface samples from Colpoys Bay (Georgian Bay) in 1993. a
Temperature
Daylength
SRSi
SRP
Chi a
Date
(0C)
(h)
(f.lmol· L-I)
(f.lg·L I)
POI
/k
(f.lg . L -I)
June 10
4.5
15.4
2.2
3.1
79
70
0.78
July I
10.5
15.4
2.0
2.4
8
150
1.73
July 22
17.5
14.9
9.5
1.9
402
0.51
Aug. 10
18.0
14.1
12.5
1.5
107
205
0.92
Sept. 2
16.8
13.1
10.4
2.3
63
170
0.20
Sept. 23
12.6
12.2
6.6
0.2
nd b
173
0.19
Oct. 14
8.4
11.1
9.8
0.4
120
ndb
0.32
Nov. 4
4.9
10.1
14.2
2.6
198
65
0.77
aSRSi and SRP are soluble reactive silica and phosphorus, respectively, /k is the photoadaptation
parameter (f.lmol photons' m- 2 • S-I), and POI is the dimensionless phosphorus deficiency index.
bnd, No data.
49
first step was an extraction in 2: 1 chloroforrn:methanol, followed by separation of
the alcohol fraction (containing LMW) and the chloroform fraction (containing
lipids). The insoluble residue from the first extraction step was then extracted in
hot 5% trichloroacetic acid to solubilize polysaccharides, leaving proteins as the
final insoluble residue. The total lipid extract was subsequently separated into
three major lipid classes, neutral, glyco-, and phospholipids, by silica gel chromatography (Smith and D'Souza, 1993).
Environmental variables monitored through the sampling period included soluble reactive silicate (SRSi) and phosphate, representing the two nutrients most
likely to be limiting for phytoplankton growth in Georgian Bay (Furgal and Smith,
1997; Munawar, 1988). Phosphorus limitation was additionally assessed by the
phosphorus deficiency index (PDI) (Lean and Pick, 1981), which uses the ratio of
P-saturated P uptake rate to light-saturated C uptake rate to characterize P deficiency. A PDr < 10 indicates severe deficiency and a PDr <50 indicates moderate
deficiency; higher values indicate slight or no deficiency. The light adaptation
parameter I k , which estimates the irradiance at which light saturation of total
photosynthesis sets in (Kirk, 1983), was calculated from the observed photosynthesis-irradiance responses to characterize the photoadaptive state of the
phytoplankton.
Nutrient availability and deficiency, and photoadaptive state, varied strongly
among sampling dates (Table 3.1). SRSi was depleted early in the stratified
period, whereas the PDr showed a period of extreme deficiency in the early part of
the stratified season (PDr < 10) but only slight or no deficiency on other dates
(PDr >50). Ik values were comparatively low before and after stratification (June
10 and November 4) and higher at other times, consistent with a relatively shadeadapted community when the water column was deeply mixed in spring and fall.
The samples from Georgian Bay therefore represented phytoplankton of widely
varying physiological status.
TABLE 3.1. Seasonal variation of physicochemical conditions and chlorophyll a (ChI a)
biomass observed in surface samples from Colpoys Bay (Georgian Bay) in 1993. a
Temperature
Daylength
SRSi
SRP
Chi a
Date
(0C)
(h)
(f.lmol· L-I)
(f.lg·L I)
POI
/k
(f.lg . L -I)
June 10
4.5
15.4
2.2
3.1
79
70
0.78
July I
10.5
15.4
2.0
2.4
8
150
1.73
July 22
17.5
14.9
9.5
1.9
402
0.51
Aug. 10
18.0
14.1
12.5
1.5
107
205
0.92
Sept. 2
16.8
13.1
10.4
2.3
63
170
0.20
Sept. 23
12.6
12.2
6.6
0.2
nd b
173
0.19
Oct. 14
8.4
11.1
9.8
0.4
120
ndb
0.32
Nov. 4
4.9
10.1
14.2
2.6
198
65
0.77
aSRSi and SRP are soluble reactive silica and phosphorus, respectively, /k is the photoadaptation
parameter (f.lmol photons' m- 2 • S-I), and POI is the dimensionless phosphorus deficiency index.
bnd, No data.