

186
Y. Olsen
100
Sum n-3
80
•
~
60
:
+ ..
CiJ
•
2
40
•
•
+
:.+
0
++
C 20
.~
A
~ . ~ 0
~
cq
0
20
40
60
80
100
:.1 2 !
0
~
+
.g
I
Sum n-6
'Vi
..
0
]
P..
+
E
+
0
+
u
-0
61
+
'u OJ
>,
+. ++
+
1a
+
"' " 41
2
•
B
0
0
4
10
12
Fatty acid composition offood (% of total FA)
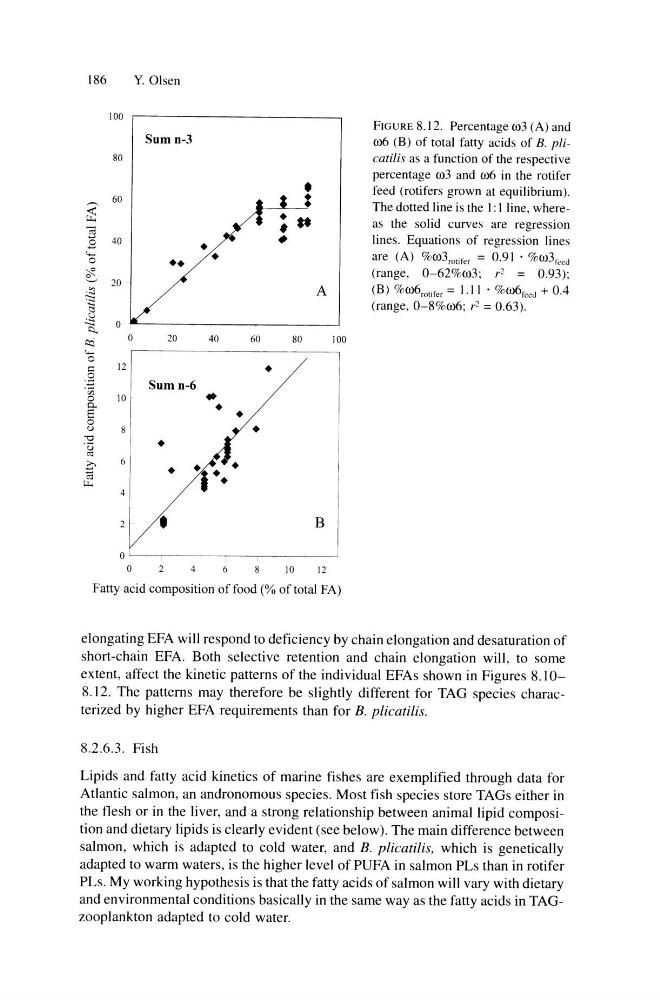
FIGURE 8.12. Percentage 003 (A) and
006 (B) of total fatty acids of B. plicalilis as a function of the respective
percentage 003 and 006 in the rotifer
feed (rotifers grown at equilibrium).
The dotted line is the I: I line, whereas the solid curves are regression
lines. Equations of regression lines
are (A) %oo3rotifer = 0.91 • o/~oo3feed
(range, 0-62%003; r" = 0.93);
(B) %oo6rotifcr = 1.11 . %oo6fced + 0.4
(range, 0-8%006; r2 = 0.63) .
elongating EFA will respond to deficiency by chain elongation and de saturation of
short-chain EFA. Both selective retention and chain elongation will, to some
extent, affect the kinetic patterns of the individual EFAs shown in Figures 8.108.12. The patterns may therefore be slightly different for TAG species characterized by higher EFA requirements than for B. plicatilis.
8.2.6.3. Fish
Lipids and fatty acid kinetics of marine fishes are exemplified through data for
Atlantic salmon, an andronomous species. Most fish species store TAGs either in
the flesh or in the liver, and a strong relationship between animal lipid composition and dietary lipids is clearly evident (see below). The main difference between
salmon, which is adapted to cold water, and B. plicatilis, which is genetically
adapted to warm waters, is the higher level of PUFA in salmon PLs than in rotifer
PLs. My working hypothesis is that the fatty acids of salmon will vary with dietary
and environmental conditions basically in the same way as the fatty acids in TAGzooplankton adapted to cold water.
Y. Olsen
100
Sum n-3
80
•
~
60
:
+ ..
CiJ
•
2
40
•
•
+
:.+
0
++
C 20
.~
A
~ . ~ 0
~
cq
0
20
40
60
80
100
:.1 2 !
0
~
+
.g
I
Sum n-6
'Vi
..
0
]
P..
+
E
+
0
+
u
-0
61
+
'u OJ
>,
+. ++
+
1a
+
"' " 41
2
•
B
0
0
4
10
12
Fatty acid composition offood (% of total FA)
FIGURE 8.12. Percentage 003 (A) and
006 (B) of total fatty acids of B. plicalilis as a function of the respective
percentage 003 and 006 in the rotifer
feed (rotifers grown at equilibrium).
The dotted line is the I: I line, whereas the solid curves are regression
lines. Equations of regression lines
are (A) %oo3rotifer = 0.91 • o/~oo3feed
(range, 0-62%003; r" = 0.93);
(B) %oo6rotifcr = 1.11 . %oo6fced + 0.4
(range, 0-8%006; r2 = 0.63) .
elongating EFA will respond to deficiency by chain elongation and de saturation of
short-chain EFA. Both selective retention and chain elongation will, to some
extent, affect the kinetic patterns of the individual EFAs shown in Figures 8.108.12. The patterns may therefore be slightly different for TAG species characterized by higher EFA requirements than for B. plicatilis.
8.2.6.3. Fish
Lipids and fatty acid kinetics of marine fishes are exemplified through data for
Atlantic salmon, an andronomous species. Most fish species store TAGs either in
the flesh or in the liver, and a strong relationship between animal lipid composition and dietary lipids is clearly evident (see below). The main difference between
salmon, which is adapted to cold water, and B. plicatilis, which is genetically
adapted to warm waters, is the higher level of PUFA in salmon PLs than in rotifer
PLs. My working hypothesis is that the fatty acids of salmon will vary with dietary
and environmental conditions basically in the same way as the fatty acids in TAGzooplankton adapted to cold water.