

'"
"0
0g
~
'"
8. Lipids and Essential Fatty Acids in Aquatic Food Webs
185
,-------~--=---=;--l
,- --~ -14:0~
~ietary ~~«!S_ I
~
I Rotifers I
16:0
,.
18:0i
I
..
i
I
I
16:11
;;::..
18:1 . . . .
20:1 ___
IIIi
22:1~
-,I
18:2w61
~
20:4w6-1
~
I
~
18:3w31
I
18:4w3 ,
-)
20:4w3!
:.20:5w3~
22:5w3~
~
22:6w3 - - - - . - -,-- - - -
o 10 20 30 40 50 0 10 20 30 40 50
Percent of total fatty acids
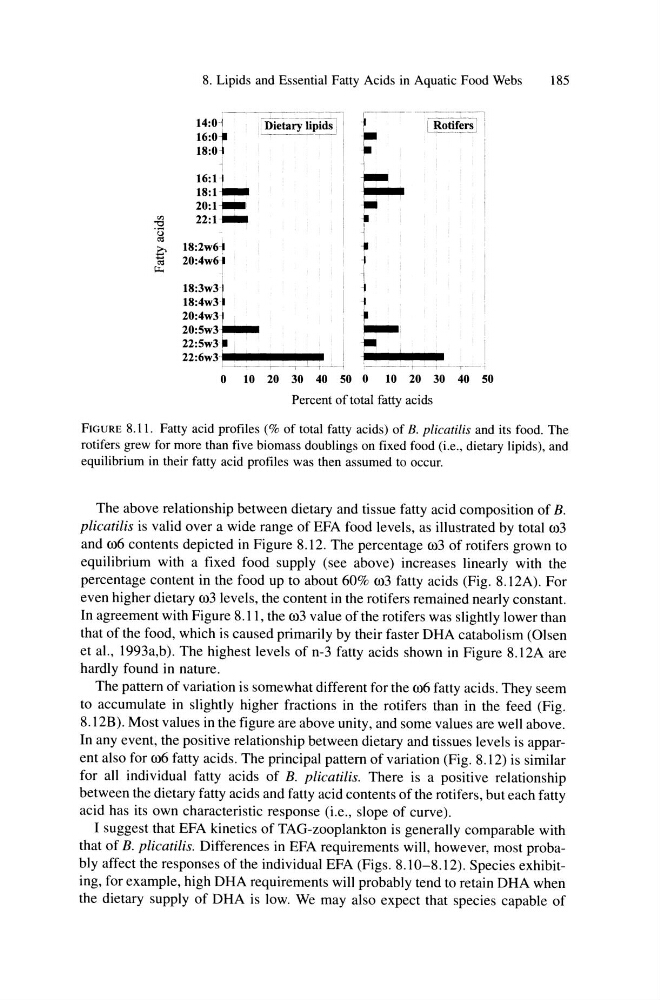
FIGURE 8.11. Fatty acid profiles (% of total fatty acids) of B. plicatilis and its food. The
rotifers grew for more than five biomass doublings on fixed food (i.e., dietary lipids), and
equilibrium in their fatty acid profiles was then assumed to occur.
The above relationship between dietary and tissue fatty acid composition of B.
plicatilis is valid over a wide range of EFA food levels, as illustrated by total 0)3
and 0)6 contents depicted in Figure 8.12. The percentage 0)3 of rotifers grown to
equilibrium with a fixed food supply (see above) increases linearly with the
percentage content in the food up to about 60% 0)3 fatty acids (Fig. 8.12A). For
even higher dietary 0)3 levels, the content in the rotifers remained nearly constant.
In agreement with Figure 8.11, the 0)3 value of the rotifers was slightly lower than
that of the food, which is caused primarily by their faster DHA catabolism (Olsen
et aI., 1993a,b). The highest levels of n-3 fatty acids shown in Figure 8.12A are
hardly found in nature.
The pattern of variation is somewhat different for the 0)6 fatty acids. They seem
to accumulate in slightly higher fractions in the rotifers than in the feed (Fig.
8.12B). Most values in the figure are above unity, and some values are well above.
In any event, the positive relationship between dietary and tissues levels is apparent also for 0)6 fatty acids. The principal pattern of variation (Fig. 8.12) is similar
for all individual fatty acids of B. plicatilis. There is a positive relationship
between the dietary fatty acids and fatty acid contents of the rotifers, but each fatty
acid has its own characteristic response (i.e., slope of curve).
I suggest that EFA kinetics of TAG-zooplankton is generally comparable with
that of B. plicatilis. Differences in EFA requirements will, however, most probably affect the responses of the individual EFA (Figs. 8.10-8.12). Species exhibiting, for example, high DHA requirements will probably tend to retain DHA when
the dietary supply of DHA is low. We may also expect that species capable of
"0
0g
~
'"
8. Lipids and Essential Fatty Acids in Aquatic Food Webs
185
,-------~--=---=;--l
,- --~ -14:0~
~ietary ~~«!S_ I
~
I Rotifers I
16:0
,.
18:0i
I
..
i
I
I
16:11
;;::..
18:1 . . . .
20:1 ___
IIIi
22:1~
-,I
18:2w61
~
20:4w6-1
~
I
~
18:3w31
I
18:4w3 ,
-)
20:4w3!
:.20:5w3~
22:5w3~
~
22:6w3 - - - - . - -,-- - - -
o 10 20 30 40 50 0 10 20 30 40 50
Percent of total fatty acids
FIGURE 8.11. Fatty acid profiles (% of total fatty acids) of B. plicatilis and its food. The
rotifers grew for more than five biomass doublings on fixed food (i.e., dietary lipids), and
equilibrium in their fatty acid profiles was then assumed to occur.
The above relationship between dietary and tissue fatty acid composition of B.
plicatilis is valid over a wide range of EFA food levels, as illustrated by total 0)3
and 0)6 contents depicted in Figure 8.12. The percentage 0)3 of rotifers grown to
equilibrium with a fixed food supply (see above) increases linearly with the
percentage content in the food up to about 60% 0)3 fatty acids (Fig. 8.12A). For
even higher dietary 0)3 levels, the content in the rotifers remained nearly constant.
In agreement with Figure 8.11, the 0)3 value of the rotifers was slightly lower than
that of the food, which is caused primarily by their faster DHA catabolism (Olsen
et aI., 1993a,b). The highest levels of n-3 fatty acids shown in Figure 8.12A are
hardly found in nature.
The pattern of variation is somewhat different for the 0)6 fatty acids. They seem
to accumulate in slightly higher fractions in the rotifers than in the feed (Fig.
8.12B). Most values in the figure are above unity, and some values are well above.
In any event, the positive relationship between dietary and tissues levels is apparent also for 0)6 fatty acids. The principal pattern of variation (Fig. 8.12) is similar
for all individual fatty acids of B. plicatilis. There is a positive relationship
between the dietary fatty acids and fatty acid contents of the rotifers, but each fatty
acid has its own characteristic response (i.e., slope of curve).
I suggest that EFA kinetics of TAG-zooplankton is generally comparable with
that of B. plicatilis. Differences in EFA requirements will, however, most probably affect the responses of the individual EFA (Figs. 8.10-8.12). Species exhibiting, for example, high DHA requirements will probably tend to retain DHA when
the dietary supply of DHA is low. We may also expect that species capable of