

Fed-Batch Bioproduction of Spectinomycin
19
g,
-=~
0='5
r~
400
300
200
100
0
*
v v
0
12
24
48
72
96
120
Time (h)
6 ~
o
3
i
144
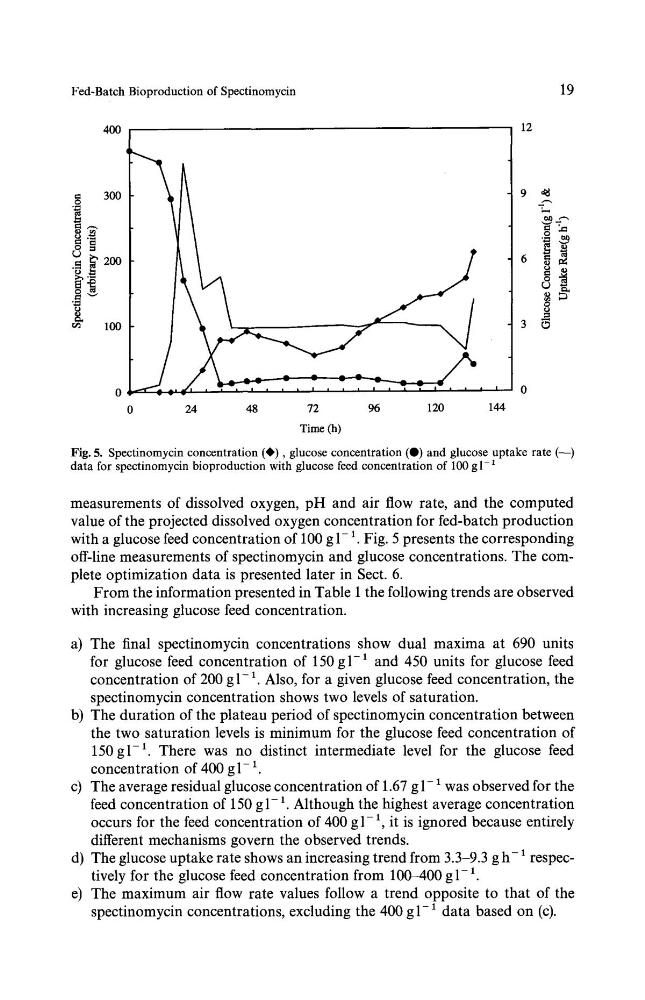
Fig. 5. Spectinomycin concentration (0), glucose concentration (O) and glucose uptake rate (--)
data for spectinomycin bioproduction with glucose feed concentration of 100 g 1 1
measurements of dissolved oxygen, pH and air flow rate, and the computed
value of the projected dissolved oxygen concentration for fed-batch production
with a glucose feed concentration of 100 g 1-1. Fig. 5 presents the corresponding
off-line measurements of spectinomycin and glucose concentrations. The complete optimization data is presented later in Sect. 6.
From the information presented in Table 1 the following trends are observed
with increasing glucose feed concentration.
a) The final spectinomycin concentrations show dual maxima at 690 units
for glucose feed concentration of 150g1-1 and 450 units for glucose feed
concentration of 200 g 1-1. Also, for a given glucose feed concentration, the
spectinomycin concentration shows two levels of saturation.
b) The duration of the plateau period of spectinomycin concentration between
the two saturation levels is minimum for the glucose feed concentration of
150g1-1. There was no distinct intermediate level for the glucose feed
concentration of 400 g 1-1
c) The average residual glucose concentration of 1.67 g 1-1 was observed for the
feed concentration of 150 g 1-1. Although the highest average concentration
occurs for the feed concentration of 400 g 1-1, it is ignored because entirely
different mechanisms govern the observed trends.
d) The glucose uptake rate shows an increasing trend from 3.3-9.3 g h- 1 respectively for the glucose feed concentration from 100400 g 1-1
e) The maximum air flow rate values follow a trend opposite to that of the
spectinomycin concentrations, excluding the 400 g 1-1 data based on (c).
19
g,
-=~
0='5
r~
400
300
200
100
0
*
v v
0
12
24
48
72
96
120
Time (h)
6 ~
o
3
i
144
Fig. 5. Spectinomycin concentration (0), glucose concentration (O) and glucose uptake rate (--)
data for spectinomycin bioproduction with glucose feed concentration of 100 g 1 1
measurements of dissolved oxygen, pH and air flow rate, and the computed
value of the projected dissolved oxygen concentration for fed-batch production
with a glucose feed concentration of 100 g 1-1. Fig. 5 presents the corresponding
off-line measurements of spectinomycin and glucose concentrations. The complete optimization data is presented later in Sect. 6.
From the information presented in Table 1 the following trends are observed
with increasing glucose feed concentration.
a) The final spectinomycin concentrations show dual maxima at 690 units
for glucose feed concentration of 150g1-1 and 450 units for glucose feed
concentration of 200 g 1-1. Also, for a given glucose feed concentration, the
spectinomycin concentration shows two levels of saturation.
b) The duration of the plateau period of spectinomycin concentration between
the two saturation levels is minimum for the glucose feed concentration of
150g1-1. There was no distinct intermediate level for the glucose feed
concentration of 400 g 1-1
c) The average residual glucose concentration of 1.67 g 1-1 was observed for the
feed concentration of 150 g 1-1. Although the highest average concentration
occurs for the feed concentration of 400 g 1-1, it is ignored because entirely
different mechanisms govern the observed trends.
d) The glucose uptake rate shows an increasing trend from 3.3-9.3 g h- 1 respectively for the glucose feed concentration from 100400 g 1-1
e) The maximum air flow rate values follow a trend opposite to that of the
spectinomycin concentrations, excluding the 400 g 1-1 data based on (c).