

20
j. Gomes and A.S. Menawat
A qualitative analysis of these observations are presented in the following
sections. A better understanding of spectinomycin biosynthesis would be possible if cell mass measurements were available, unfortunately, accurate cell mass
measurements in complex media with Streptomyces was not possible.
4.2 Characteristics of Spectinomycin Bioproduction
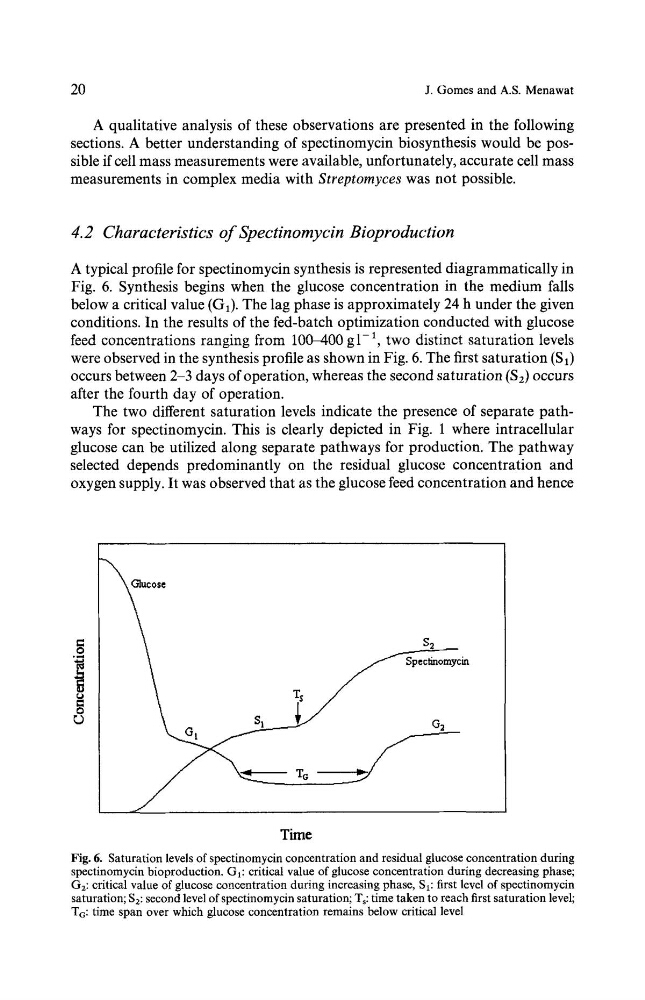
A typical profile for spectinomycin synthesis is represented diagrammatically in
Fig. 6. Synthesis begins when the glucose concentration in the medium falls
below a critical value (G1). The lag phase is approximately 24 h under the given
conditions. In the results of the fed-batch optimization conducted with glucose
feed concentrations ranging from 100-400 g1-1, two distinct saturation levels
were observed in the synthesis profile as shown in Fig. 6. The first saturation ($1)
occurs between 2-3 days of operation, whereas the second saturation ($2) occurs
after the fourth day of operation.
The two different saturation levels indicate the presence of separate pathways for spectinomycin. This is clearly depicted in Fig. 1 where intracellular
glucose can be utilized along separate pathways for production. The pathway
selected depends predominantly on the residual glucose concentration and
oxygen supply. It was observed that as the glucose feed concentration and hence
Time
Fig. 6. Saturation levels of spectinomycin concentration and residual glucose concentration during
spectinomycin bioproduction. GI: critical value of glucose concentration during decreasing phase;
G2: critical value of glucose concentration during increasing phase, $1: first level of spectinomycin
saturation; $2: second level of spectinomycin saturation; Ts: time taken to reach first saturation level;
Tr: time span over which glucose concentration remains below critical level
j. Gomes and A.S. Menawat
A qualitative analysis of these observations are presented in the following
sections. A better understanding of spectinomycin biosynthesis would be possible if cell mass measurements were available, unfortunately, accurate cell mass
measurements in complex media with Streptomyces was not possible.
4.2 Characteristics of Spectinomycin Bioproduction
A typical profile for spectinomycin synthesis is represented diagrammatically in
Fig. 6. Synthesis begins when the glucose concentration in the medium falls
below a critical value (G1). The lag phase is approximately 24 h under the given
conditions. In the results of the fed-batch optimization conducted with glucose
feed concentrations ranging from 100-400 g1-1, two distinct saturation levels
were observed in the synthesis profile as shown in Fig. 6. The first saturation ($1)
occurs between 2-3 days of operation, whereas the second saturation ($2) occurs
after the fourth day of operation.
The two different saturation levels indicate the presence of separate pathways for spectinomycin. This is clearly depicted in Fig. 1 where intracellular
glucose can be utilized along separate pathways for production. The pathway
selected depends predominantly on the residual glucose concentration and
oxygen supply. It was observed that as the glucose feed concentration and hence
Time
Fig. 6. Saturation levels of spectinomycin concentration and residual glucose concentration during
spectinomycin bioproduction. GI: critical value of glucose concentration during decreasing phase;
G2: critical value of glucose concentration during increasing phase, $1: first level of spectinomycin
saturation; $2: second level of spectinomycin saturation; Ts: time taken to reach first saturation level;
Tr: time span over which glucose concentration remains below critical level