

18
J. Gomes and A.S. Menawat
for biosynthesis we did not expect significant variations from these results for
more extended optimizations. The results are presented comprehensively in
Table 1. The actual spectinomycin concentration values are not revealed and
have been presented in new scaled units. The time-weighted averages of the
residual glucose concentration and the glucose uptake rate are also presented.
Although the time weighted averages are useful in interpreting the data, the
nature of the actual profiles must also be considered for a more complete
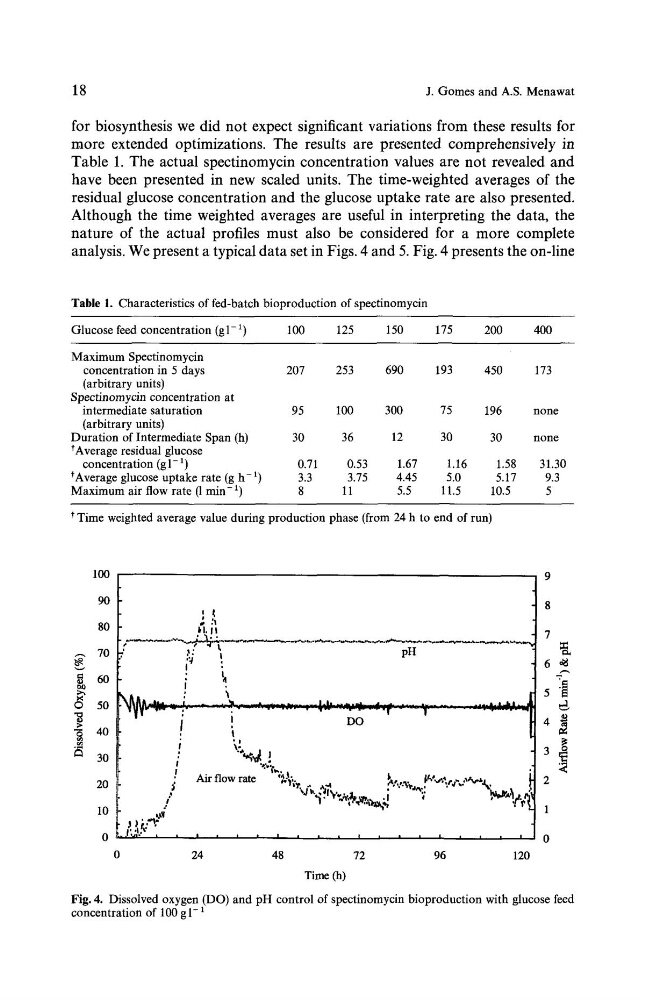
analysis. We present a typical data set in Figs. 4 and 5. Fig. 4 presents the on-line
Table 1. Characteristics of fed-batch bioproduction of spectinomycin
Glucose feed concentration (gl-1)
100
125
150
175
200
400
Maximum Spectinomycin
concentration in 5 days
(arbitrary units)
Spectinomycin concentration at
intermediate saturation
(arbitrary units)
Duration of Intermediate Span (h)
tAverage residual glucose
concentration (g 1-1)
*Average glucose uptake rate (g h- 1)
Maximum air flow rate (1 min-1)
207
253
690
193
450
173
95
100
300
75
196
none
30
36
12
30
30
none
0.71
0.53
1.67
1.16
1.58
31.30
3.3
3.75
4.45
5.0
5.17
9.3
8
11
5.5
11.5
10.5
5
* Time weighted average value during production phase (from 24 h to end of run)
100
9
90
8
g
80
hi. it
7
70
, , . . ~ ,
pa
5
0
50
~.J~"
" '
-
" ~ ................
Jd. .......................
,_L...kL~,
I
'
Do
]
40
i
30
;
!
3
'
Air flow rate
'~f'~ ~ ~q
~'.'-x~ ,/A',,~tr
2
10
0
" a]~
t
i
I
i
'
I
I
i
I
I
'
~
'
i
i
i
i
I
0
0
24
48
72
96
120
Time (h)
Fig. 4. Dissolved oxygen (DO) and pH control of spectinomycin bioproduction with glucose feed
concentration of 100 g 1-1
J. Gomes and A.S. Menawat
for biosynthesis we did not expect significant variations from these results for
more extended optimizations. The results are presented comprehensively in
Table 1. The actual spectinomycin concentration values are not revealed and
have been presented in new scaled units. The time-weighted averages of the
residual glucose concentration and the glucose uptake rate are also presented.
Although the time weighted averages are useful in interpreting the data, the
nature of the actual profiles must also be considered for a more complete
analysis. We present a typical data set in Figs. 4 and 5. Fig. 4 presents the on-line
Table 1. Characteristics of fed-batch bioproduction of spectinomycin
Glucose feed concentration (gl-1)
100
125
150
175
200
400
Maximum Spectinomycin
concentration in 5 days
(arbitrary units)
Spectinomycin concentration at
intermediate saturation
(arbitrary units)
Duration of Intermediate Span (h)
tAverage residual glucose
concentration (g 1-1)
*Average glucose uptake rate (g h- 1)
Maximum air flow rate (1 min-1)
207
253
690
193
450
173
95
100
300
75
196
none
30
36
12
30
30
none
0.71
0.53
1.67
1.16
1.58
31.30
3.3
3.75
4.45
5.0
5.17
9.3
8
11
5.5
11.5
10.5
5
* Time weighted average value during production phase (from 24 h to end of run)
100
9
90
8
g
80
hi. it
7
70
, , . . ~ ,
pa
5
0
50
~.J~"
" '
-
" ~ ................
Jd. .......................
,_L...kL~,
I
'
Do
]
40
i
30
;
!
3
'
Air flow rate
'~f'~ ~ ~q
~'.'-x~ ,/A',,~tr
2
10
0
" a]~
t
i
I
i
'
I
I
i
I
I
'
~
'
i
i
i
i
I
0
0
24
48
72
96
120
Time (h)
Fig. 4. Dissolved oxygen (DO) and pH control of spectinomycin bioproduction with glucose feed
concentration of 100 g 1-1