

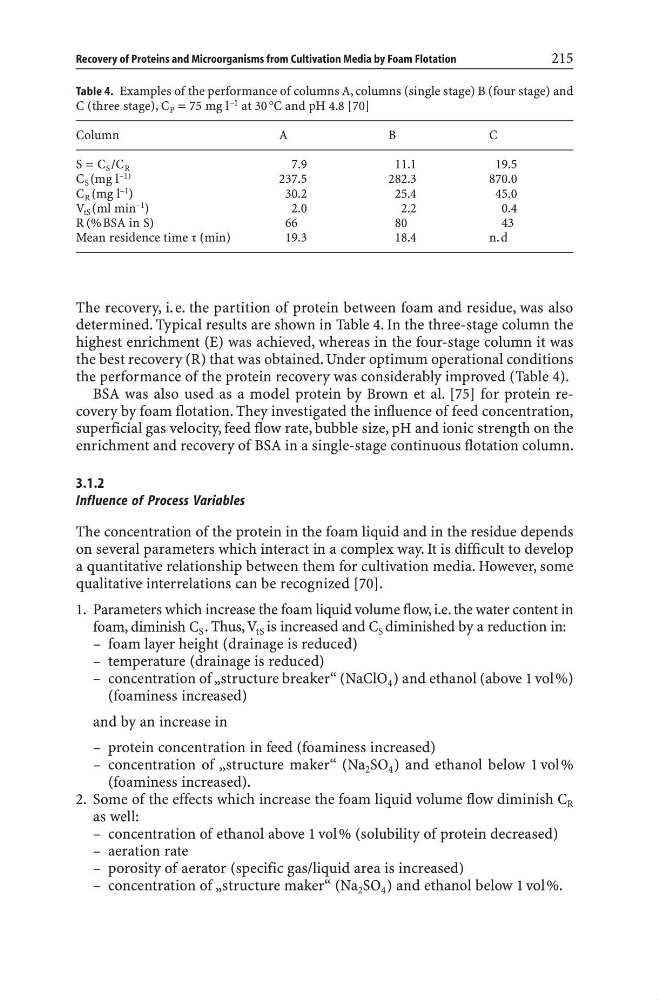
The recovery, i.e. the partition of protein between foam and residue, was also
determined. Typical results are shown in Table 4. In the three-stage column the
highest enrichment (E) was achieved, whereas in the four-stage column it was
the best recovery (R) that was obtained. Under optimum operational conditions
the performance of the protein recovery was considerably improved (Table 4).
BSA was also used as a model protein by Brown et al. [75] for protein recovery by foam flotation. They investigated the influence of feed concentration,
superficial gas velocity, feed flow rate, bubble size, pH and ionic strength on the
enrichment and recovery of BSA in a single-stage continuous flotation column.
3.1.2
Influence of Process Variables
The concentration of the protein in the foam liquid and in the residue depends
on several parameters which interact in a complex way. It is difficult to develop
a quantitative relationship between them for cultivation media. However, some
qualitative interrelations can be recognized [70].
1. Parameters which increase the foam liquid volume flow, i.e. the water content in
foam, diminish C S . Thus, V tS is increased and C S diminished by a reduction in:
– foam layer height (drainage is reduced)
– temperature (drainage is reduced)
– concentration of „structure breaker“ (NaClO 4 ) and ethanol (above 1 vol%)
(foaminess increased)
and by an increase in
– protein concentration in feed (foaminess increased)
– concentration of „structure maker“ (Na 2 SO 4 ) and ethanol below 1 vol%
(foaminess increased).
2. Some of the effects which increase the foam liquid volume flow diminish C R
as well:
– concentration of ethanol above 1 vol% (solubility of protein decreased)
– aeration rate
– porosity of aerator (specific gas/liquid area is increased)
– concentration of „structure maker“ (Na 2 SO 4 ) and ethanol below 1 vol%.
Recovery of Proteins and Microorganisms from Cultivation Media by Foam Flotation
215
Table 4. Examples of the performance of columns A, columns (single stage) B (four stage) and
C (three stage), C P = 75 mg l –1 at 30 °C and pH 4.8 [70]
Column
A
B
C
S = C S /C R
7.9
11.1
19.5
C S (mg l –1)
237.5
282.3
870.0
C R (mg l –1 )
30.2
25.4
45.0
V tS (ml min –1 )
2.0
2.2
0.4
R (%BSA in S)
66
80
43
Mean residence time t (min)
19.3
18.4
n.d
determined. Typical results are shown in Table 4. In the three-stage column the
highest enrichment (E) was achieved, whereas in the four-stage column it was
the best recovery (R) that was obtained. Under optimum operational conditions
the performance of the protein recovery was considerably improved (Table 4).
BSA was also used as a model protein by Brown et al. [75] for protein recovery by foam flotation. They investigated the influence of feed concentration,
superficial gas velocity, feed flow rate, bubble size, pH and ionic strength on the
enrichment and recovery of BSA in a single-stage continuous flotation column.
3.1.2
Influence of Process Variables
The concentration of the protein in the foam liquid and in the residue depends
on several parameters which interact in a complex way. It is difficult to develop
a quantitative relationship between them for cultivation media. However, some
qualitative interrelations can be recognized [70].
1. Parameters which increase the foam liquid volume flow, i.e. the water content in
foam, diminish C S . Thus, V tS is increased and C S diminished by a reduction in:
– foam layer height (drainage is reduced)
– temperature (drainage is reduced)
– concentration of „structure breaker“ (NaClO 4 ) and ethanol (above 1 vol%)
(foaminess increased)
and by an increase in
– protein concentration in feed (foaminess increased)
– concentration of „structure maker“ (Na 2 SO 4 ) and ethanol below 1 vol%
(foaminess increased).
2. Some of the effects which increase the foam liquid volume flow diminish C R
as well:
– concentration of ethanol above 1 vol% (solubility of protein decreased)
– aeration rate
– porosity of aerator (specific gas/liquid area is increased)
– concentration of „structure maker“ (Na 2 SO 4 ) and ethanol below 1 vol%.
Recovery of Proteins and Microorganisms from Cultivation Media by Foam Flotation
215
Table 4. Examples of the performance of columns A, columns (single stage) B (four stage) and
C (three stage), C P = 75 mg l –1 at 30 °C and pH 4.8 [70]
Column
A
B
C
S = C S /C R
7.9
11.1
19.5
C S (mg l –1)
237.5
282.3
870.0
C R (mg l –1 )
30.2
25.4
45.0
V tS (ml min –1 )
2.0
2.2
0.4
R (%BSA in S)
66
80
43
Mean residence time t (min)
19.3
18.4
n.d