

3. When C S and C R change in the same direction, then:
– C S /C R increases if the aeration rate is reduced
– C S /C R diminishes if Na 2 SO 4 or ethanol is added to the solution.
4. The separation (C S /C R ) can be increased by a decrease in:
– aeration rate
– protein concentration in feed
– ethanol concentration above 1 vol%
and by an increase in
– porosity of the aerator
– temperature
– liquid and foam layer heights
– concentration of „structure breaker“ and ethanol concentration below
1 vol%, and
– at the isoelectric point (pH 4.8–5.0).
3.2
Separation of Protein Mixtures
Ostermaier and Dobiás [76] investigated the possibility of separating proteins
with different isoelectric points (IEPs) by flotation from mixtures by varying
the pH of the solution, together with certain concentrations of structure maker
and structure breaker. They applied a mixture of the following proteins: fetuin,
BSA, hemoglobin, myoglobin, chymotrypsinogen A and cytochrome c with
IEPs in the range 3.5 to 10.2. Measurements of solutions of the same proteins at
various pH values showed that the minimum surface tension occurs at the IEP
of the protein concerned. The surface tension of the protein mixture as a function of the pH indicated that IEPs of particular proteins are nearly the same as
the IEPs of the single proteins. Therefore, protein separation should be possible
216
K. Schügerl
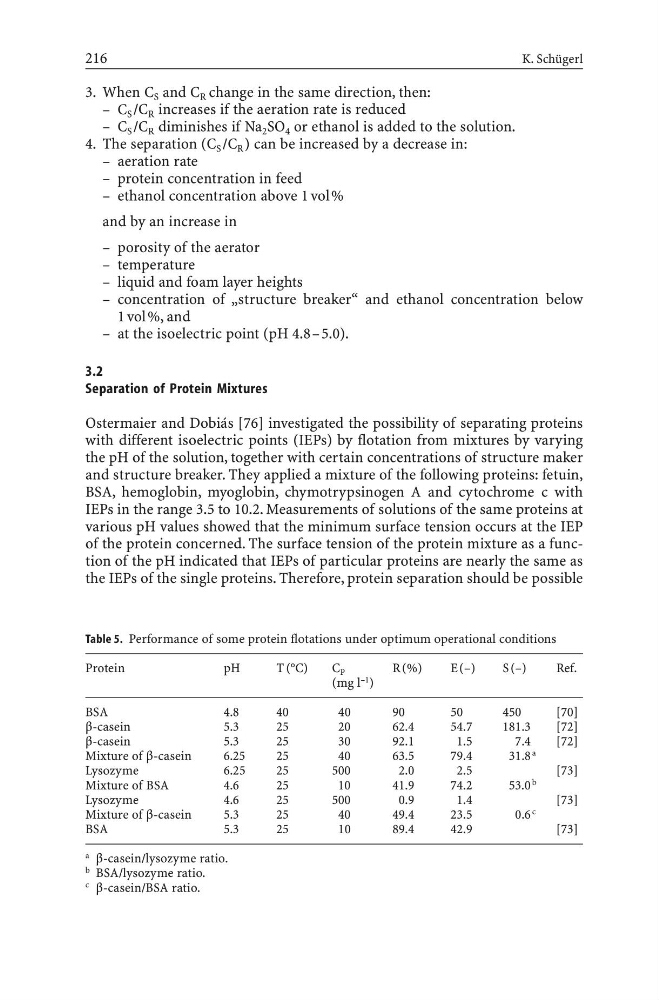
Table 5. Performance of some protein flotations under optimum operational conditions
Protein
pH
T (°C)
C P
R(%)
E(–)
S(–)
Ref.
(mg l
–1 )
BSA
4.8
40
40
90
50
450
[70]
b-casein
5.3
25
20
62.4
54.7
181.3
[72]
b-casein
5.3
25
30
92.1
1.5
7.4
[72]
Mixture of b-casein
6.25
25
40
63.5
79.4
31.8
a
Lysozyme
6.25
25
500
2.0
2.5
[73]
Mixture of BSA
4.6
25
10
41.9
74.2
53.0
b
Lysozyme
4.6
25
500
0.9
1.4
[73]
Mixture of b-casein
5.3
25
40
49.4
23.5
0.6
c
BSA
5.3
25
10
89.4
42.9
[73]
a b-casein/lysozyme ratio.
b BSA/lysozyme ratio.
c b-casein/BSA ratio.
– C S /C R increases if the aeration rate is reduced
– C S /C R diminishes if Na 2 SO 4 or ethanol is added to the solution.
4. The separation (C S /C R ) can be increased by a decrease in:
– aeration rate
– protein concentration in feed
– ethanol concentration above 1 vol%
and by an increase in
– porosity of the aerator
– temperature
– liquid and foam layer heights
– concentration of „structure breaker“ and ethanol concentration below
1 vol%, and
– at the isoelectric point (pH 4.8–5.0).
3.2
Separation of Protein Mixtures
Ostermaier and Dobiás [76] investigated the possibility of separating proteins
with different isoelectric points (IEPs) by flotation from mixtures by varying
the pH of the solution, together with certain concentrations of structure maker
and structure breaker. They applied a mixture of the following proteins: fetuin,
BSA, hemoglobin, myoglobin, chymotrypsinogen A and cytochrome c with
IEPs in the range 3.5 to 10.2. Measurements of solutions of the same proteins at
various pH values showed that the minimum surface tension occurs at the IEP
of the protein concerned. The surface tension of the protein mixture as a function of the pH indicated that IEPs of particular proteins are nearly the same as
the IEPs of the single proteins. Therefore, protein separation should be possible
216
K. Schügerl
Table 5. Performance of some protein flotations under optimum operational conditions
Protein
pH
T (°C)
C P
R(%)
E(–)
S(–)
Ref.
(mg l
–1 )
BSA
4.8
40
40
90
50
450
[70]
b-casein
5.3
25
20
62.4
54.7
181.3
[72]
b-casein
5.3
25
30
92.1
1.5
7.4
[72]
Mixture of b-casein
6.25
25
40
63.5
79.4
31.8
a
Lysozyme
6.25
25
500
2.0
2.5
[73]
Mixture of BSA
4.6
25
10
41.9
74.2
53.0
b
Lysozyme
4.6
25
500
0.9
1.4
[73]
Mixture of b-casein
5.3
25
40
49.4
23.5
0.6
c
BSA
5.3
25
10
89.4
42.9
[73]
a b-casein/lysozyme ratio.
b BSA/lysozyme ratio.
c b-casein/BSA ratio.