

apparatus. This piece of equipment was operated as a three- and four-stage
bubble column, respectively. The pH value of the feed solution was controlled
by a pH meter.
The electrical conductivity of the foam was measured on-line to control the
steady state of the process. Results were only accepted if they had been obtained
under steady state conditions. The protein concentrations were determined by
a photometer at 275.5 and 320 nm and the difference was used for to correct for
the error due to the turbidity of the solution.
3.1.1
Characterization of Process Performance
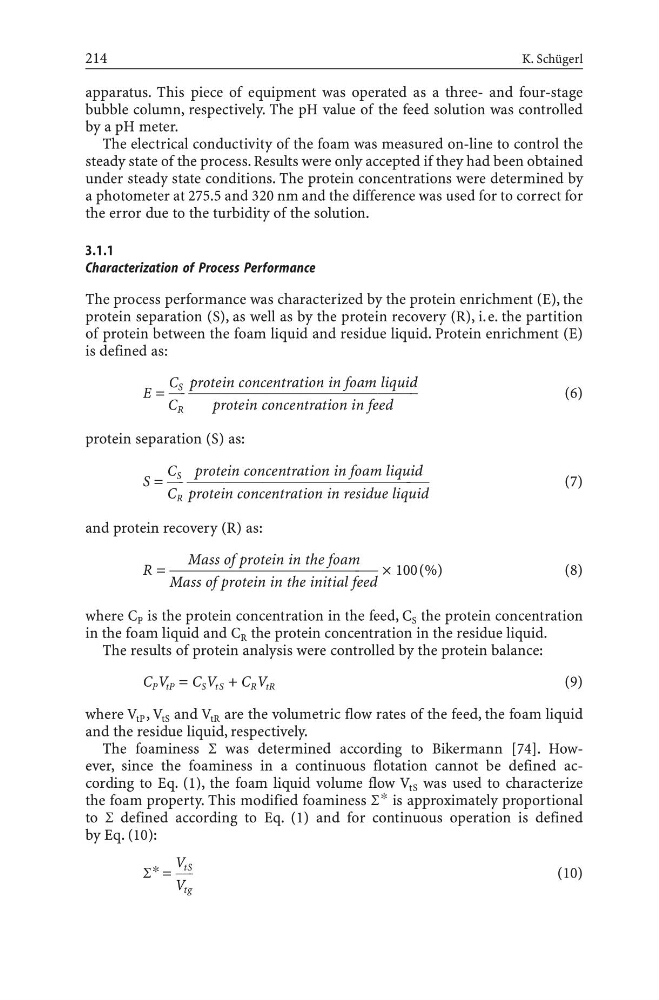
The process performance was characterized by the protein enrichment (E), the
protein separation (S), as well as by the protein recovery (R), i.e. the partition
of protein between the foam liquid and residue liquid. Protein enrichment (E)
is defined as:
C S protein concentration in foam liquid
E = 41 0000092
(6)
C R
protein concentration in feed
protein separation (S) as:
C S protein concentration in foam liquid
S = 41 0000096
(7)
C R protein concentration in residue liquid
and protein recovery (R) as:
Mass of protein in the foam
R = 000006 ¥ 100(%)
(8)
Mass of protein in the initial feed
where C P is the protein concentration in the feed, C S the protein concentration
in the foam liquid and C R the protein concentration in the residue liquid.
The results of protein analysis were controlled by the protein balance:
C P V tP = C S V tS + C R V tR
(9)
where V tP , V tS and V tR are the volumetric flow rates of the feed, the foam liquid
and the residue liquid, respectively.
The foaminess S was determined according to Bikermann [74]. However, since the foaminess in a continuous flotation cannot be defined according to Eq. (1), the foam liquid volume flow V tS was used to characterize
the foam property. This modified foaminess S * is approximately proportional
to S defined according to Eq. (1) and for continuous operation is defined
by Eq. (10):
V tS
S * = 41
(10)
V tg
214
K. Schügerl
bubble column, respectively. The pH value of the feed solution was controlled
by a pH meter.
The electrical conductivity of the foam was measured on-line to control the
steady state of the process. Results were only accepted if they had been obtained
under steady state conditions. The protein concentrations were determined by
a photometer at 275.5 and 320 nm and the difference was used for to correct for
the error due to the turbidity of the solution.
3.1.1
Characterization of Process Performance
The process performance was characterized by the protein enrichment (E), the
protein separation (S), as well as by the protein recovery (R), i.e. the partition
of protein between the foam liquid and residue liquid. Protein enrichment (E)
is defined as:
C S protein concentration in foam liquid
E = 41 0000092
(6)
C R
protein concentration in feed
protein separation (S) as:
C S protein concentration in foam liquid
S = 41 0000096
(7)
C R protein concentration in residue liquid
and protein recovery (R) as:
Mass of protein in the foam
R = 000006 ¥ 100(%)
(8)
Mass of protein in the initial feed
where C P is the protein concentration in the feed, C S the protein concentration
in the foam liquid and C R the protein concentration in the residue liquid.
The results of protein analysis were controlled by the protein balance:
C P V tP = C S V tS + C R V tR
(9)
where V tP , V tS and V tR are the volumetric flow rates of the feed, the foam liquid
and the residue liquid, respectively.
The foaminess S was determined according to Bikermann [74]. However, since the foaminess in a continuous flotation cannot be defined according to Eq. (1), the foam liquid volume flow V tS was used to characterize
the foam property. This modified foaminess S * is approximately proportional
to S defined according to Eq. (1) and for continuous operation is defined
by Eq. (10):
V tS
S * = 41
(10)
V tg
214
K. Schügerl