

Biomolecular Interaction of Matrix Metalloproteinases and Their Inhibitors TIMPs
E OR
HIP
\1\1P
OPTICAL
DFTfCTIO
L 11
FLOW CH '\
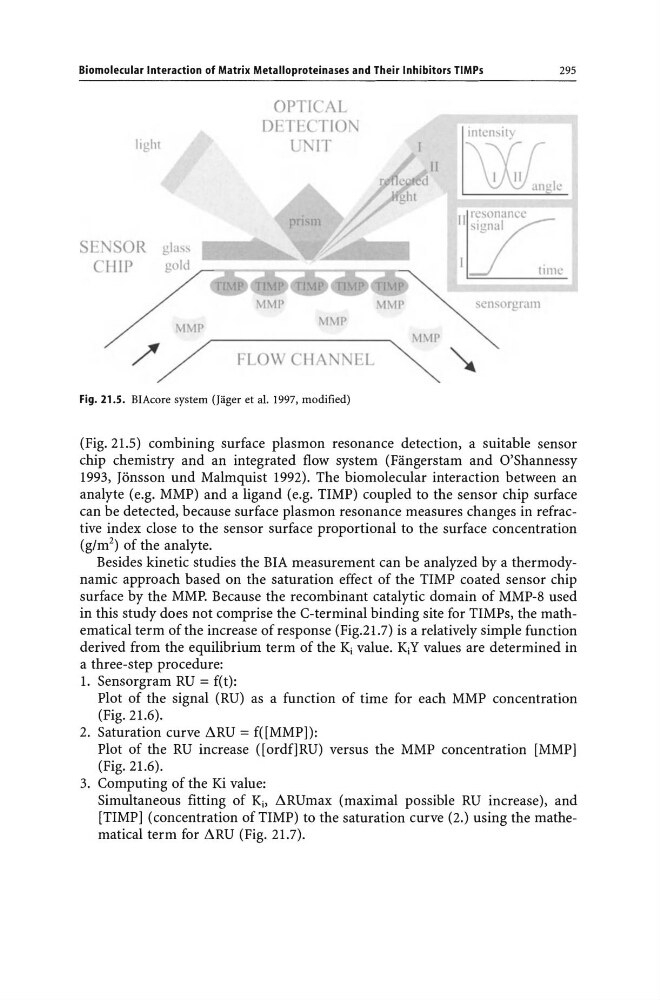
Fig. 21.5. BIAcore system (Jager et al. 1997, modified)
scnsorgram
1\11'
EL
295
(Fig. 21.5) combining surface plasmon resonance detection, a suitable sensor
chip chemistry and an integrated flow system (Fangerstam and Q'Shannessy
1993, Jonsson und Malmquist 1992). The biomolecular interaction between an
analyte (e.g. MMP) and a ligand (e.g. TIMP) coupled to the sensor chip surface
can be detected, because surface plasmon resonance measures changes in refractive index close to the sensor surface proportional to the surface concentration
(g/m2) of the analyte.
Besides kinetic studies the BIA measurement can be analyzed by a thermodynamic approach based on the saturation effect of the TIMP coated sensor chip
surface by the MMP. Because the recombinant catalytic domain of MMP-8 used
in this study does not comprise the C-terminal binding site for TIMPs, the mathematical term of the increase of response (Fig.21.7) is a relatively simple function
derived from the equilibrium term of the Kj value. KjY values are determined in
a three-step procedure:
1. Sensorgram RU = f(t):
Plot of the signal (RU) as a function of time for each MMP concentration
(Fig. 21.6).
2. Saturation curve LlRU = f([MMP]):
Plot of the RU increase ([ordf]RU) versus the MMP concentration [MMP]
(Fig. 21.6).
3. Computing of the Ki value:
Simultaneous fitting of Kj, LlRUmax (maximal possible RU increase), and
[TIMP] (concentration ofTIMP) to the saturation curve (2.) using the mathematical term for LlRU (Fig. 21.7).
E OR
HIP
\1\1P
OPTICAL
DFTfCTIO
L 11
FLOW CH '\
Fig. 21.5. BIAcore system (Jager et al. 1997, modified)
scnsorgram
1\11'
EL
295
(Fig. 21.5) combining surface plasmon resonance detection, a suitable sensor
chip chemistry and an integrated flow system (Fangerstam and Q'Shannessy
1993, Jonsson und Malmquist 1992). The biomolecular interaction between an
analyte (e.g. MMP) and a ligand (e.g. TIMP) coupled to the sensor chip surface
can be detected, because surface plasmon resonance measures changes in refractive index close to the sensor surface proportional to the surface concentration
(g/m2) of the analyte.
Besides kinetic studies the BIA measurement can be analyzed by a thermodynamic approach based on the saturation effect of the TIMP coated sensor chip
surface by the MMP. Because the recombinant catalytic domain of MMP-8 used
in this study does not comprise the C-terminal binding site for TIMPs, the mathematical term of the increase of response (Fig.21.7) is a relatively simple function
derived from the equilibrium term of the Kj value. KjY values are determined in
a three-step procedure:
1. Sensorgram RU = f(t):
Plot of the signal (RU) as a function of time for each MMP concentration
(Fig. 21.6).
2. Saturation curve LlRU = f([MMP]):
Plot of the RU increase ([ordf]RU) versus the MMP concentration [MMP]
(Fig. 21.6).
3. Computing of the Ki value:
Simultaneous fitting of Kj, LlRUmax (maximal possible RU increase), and
[TIMP] (concentration ofTIMP) to the saturation curve (2.) using the mathematical term for LlRU (Fig. 21.7).