

E ¼
ln
e:e: P 1 À e:e: S
ð
Þ
½
e:e: P þ e:e: S
ð
Þ
ln
e:e: P 1 þ e:e: S
ð
Þ
½
e:e: P þ e:e: S
ð
Þ
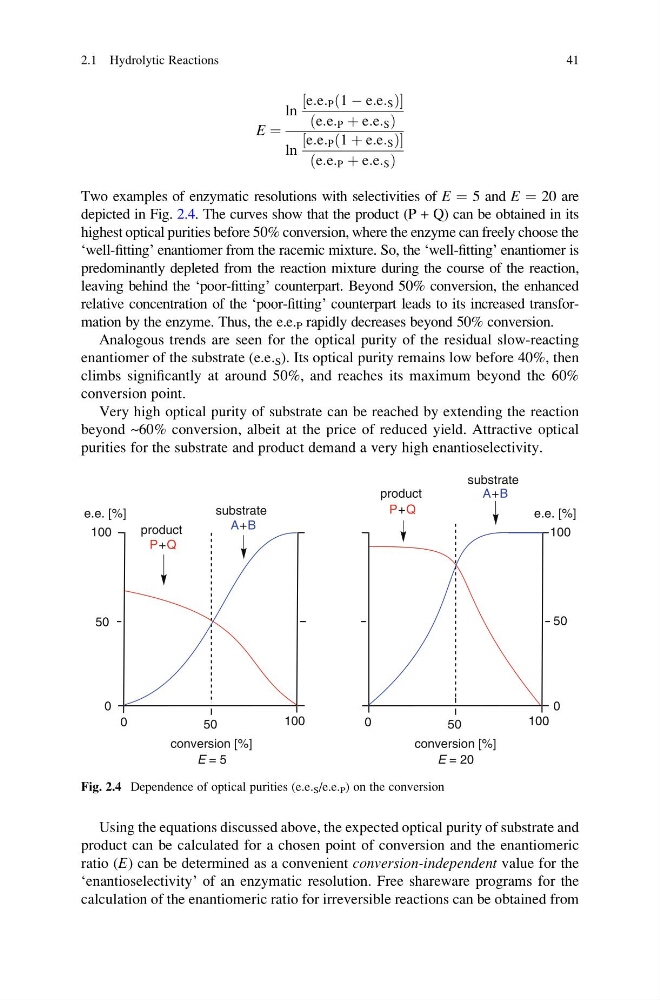
Two examples of enzymatic resolutions with selectivities of E ¼ 5 and E ¼ 20 are
depicted in Fig. 2.4. The curves show that the product (P + Q) can be obtained in its
highest optical purities before 50% conversion, where the enzyme can freely choose the
‘well-fitting’ enantiomer from the racemic mixture. So, the ‘well-fitting’ enantiomer is
predominantly depleted from the reaction mixture during the course of the reaction,
leaving behind the ‘poor-fitting’ counterpart. Beyond 50% conversion, the enhanced
relative concentration of the ‘poor-fitting’ counterpart leads to its increased transformation by the enzyme. Thus, the e.e. P rapidly decreases beyond 50% conversion.
Analogous trends are seen for the optical purity of the residual slow-reacting
enantiomer of the substrate (e.e. S ). Its optical purity remains low before 40%, then
climbs significantly at around 50%, and reaches its maximum beyond the 60%
conversion point.
Very high optical purity of substrate can be reached by extending the reaction
beyond ~60% conversion, albeit at the price of reduced yield. Attractive optical
purities for the substrate and product demand a very high enantioselectivity.
Using the equations discussed above, the expected optical purity of substrate and
product can be calculated for a chosen point of conversion and the enantiomeric
ratio (E) can be determined as a convenient conversion-independent value for the
‘enantioselectivity’ of an enzymatic resolution. Free shareware programs for the
calculation of the enantiomeric ratio for irreversible reactions can be obtained from
P+Q
A+B
A+B
P+Q
50
50
e.e. [%]
100
0
0
100
product
substrate
50
50
e.e. [%]
100
0
0
100
product
substrate
E = 5
conversion [%]
E = 20
conversion [%]
Fig. 2.4 Dependence of optical purities (e.e. S /e.e. P ) on the conversion
2.1 Hydrolytic Reactions
41
ln
e:e: P 1 À e:e: S
ð
Þ
½
e:e: P þ e:e: S
ð
Þ
ln
e:e: P 1 þ e:e: S
ð
Þ
½
e:e: P þ e:e: S
ð
Þ
Two examples of enzymatic resolutions with selectivities of E ¼ 5 and E ¼ 20 are
depicted in Fig. 2.4. The curves show that the product (P + Q) can be obtained in its
highest optical purities before 50% conversion, where the enzyme can freely choose the
‘well-fitting’ enantiomer from the racemic mixture. So, the ‘well-fitting’ enantiomer is
predominantly depleted from the reaction mixture during the course of the reaction,
leaving behind the ‘poor-fitting’ counterpart. Beyond 50% conversion, the enhanced
relative concentration of the ‘poor-fitting’ counterpart leads to its increased transformation by the enzyme. Thus, the e.e. P rapidly decreases beyond 50% conversion.
Analogous trends are seen for the optical purity of the residual slow-reacting
enantiomer of the substrate (e.e. S ). Its optical purity remains low before 40%, then
climbs significantly at around 50%, and reaches its maximum beyond the 60%
conversion point.
Very high optical purity of substrate can be reached by extending the reaction
beyond ~60% conversion, albeit at the price of reduced yield. Attractive optical
purities for the substrate and product demand a very high enantioselectivity.
Using the equations discussed above, the expected optical purity of substrate and
product can be calculated for a chosen point of conversion and the enantiomeric
ratio (E) can be determined as a convenient conversion-independent value for the
‘enantioselectivity’ of an enzymatic resolution. Free shareware programs for the
calculation of the enantiomeric ratio for irreversible reactions can be obtained from
P+Q
A+B
A+B
P+Q
50
50
e.e. [%]
100
0
0
100
product
substrate
50
50
e.e. [%]
100
0
0
100
product
substrate
E = 5
conversion [%]
E = 20
conversion [%]
Fig. 2.4 Dependence of optical purities (e.e. S /e.e. P ) on the conversion
2.1 Hydrolytic Reactions
41