

Oscillatory Control of Glycolysis as Model for Timing Processes
211
Further information about flux rates in a metabolic pathway can be
derived from calculations of the apparent equilibrium constant of an enzy0.S
20.
25
30.
Fluorescence
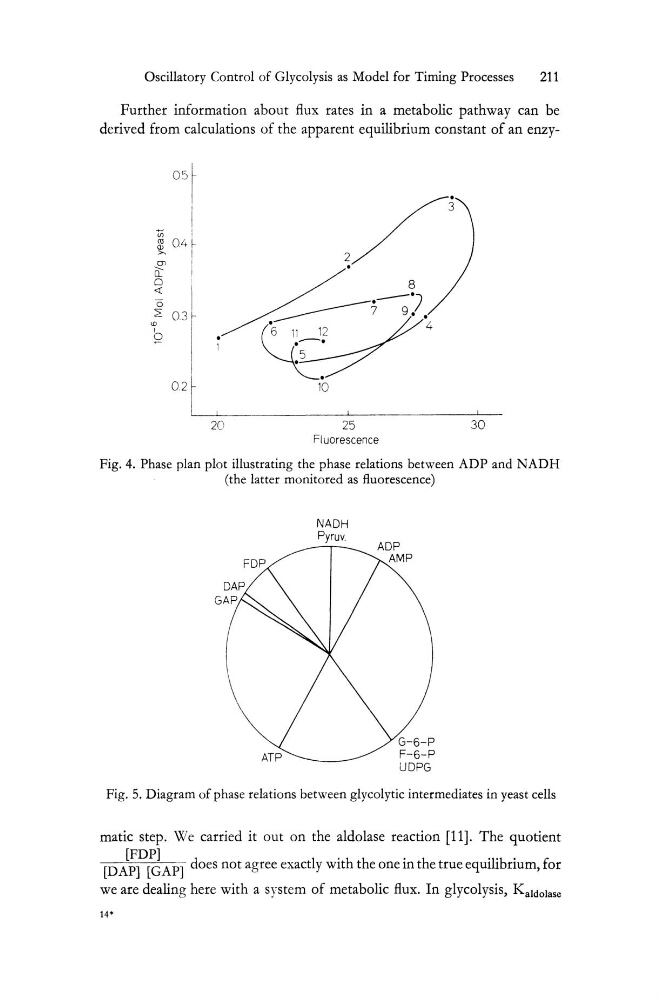
Fig. 4. Phase plan plot illustrating the phase relations between ADP and NADH
(the latter monitored as fluorescence)
NADH
Pyruv.
G-6-P
F-6-P
UDPG
Fig. 5. Diagram of phase relations between glycolytic intermediates in yeast cells
matic step. We carried it out on the aldolase reaction [11]. The quotient
[FDP]
d
1 . h h
. h
·l·b .
r:
[DAP] [GAP] oes not agree exact y wlt t e one 1ll t e true equl1 num, lor
we are dealing here with a system of metabolic flux. In glycolysis, Kaldolase
14*
211
Further information about flux rates in a metabolic pathway can be
derived from calculations of the apparent equilibrium constant of an enzy0.S
20.
25
30.
Fluorescence
Fig. 4. Phase plan plot illustrating the phase relations between ADP and NADH
(the latter monitored as fluorescence)
NADH
Pyruv.
G-6-P
F-6-P
UDPG
Fig. 5. Diagram of phase relations between glycolytic intermediates in yeast cells
matic step. We carried it out on the aldolase reaction [11]. The quotient
[FDP]
d
1 . h h
. h
·l·b .
r:
[DAP] [GAP] oes not agree exact y wlt t e one 1ll t e true equl1 num, lor
we are dealing here with a system of metabolic flux. In glycolysis, Kaldolase
14*