

find the steady state of this system. However, this steady state is unstable. To
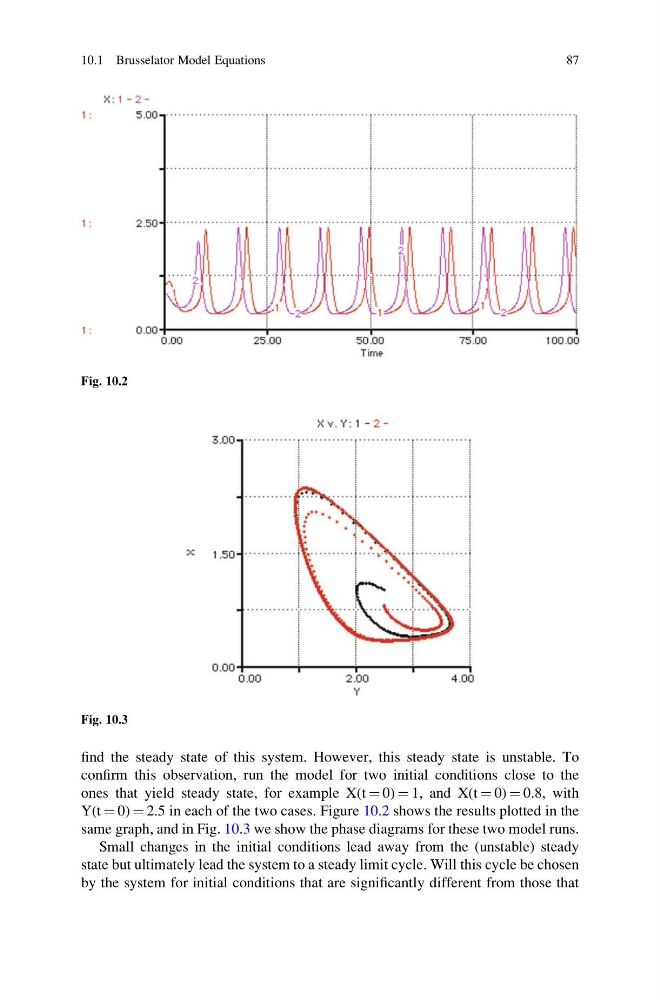
confirm this observation, run the model for two initial conditions close to the
ones that yield steady state, for example X(t ¼ 0) ¼ 1, and X(t ¼ 0) ¼ 0.8, with
Y(t ¼ 0) ¼ 2.5 in each of the two cases. Figure 10.2 shows the results plotted in the
same graph, and in Fig. 10.3 we show the phase diagrams for these two model runs.
Small changes in the initial conditions lead away from the (unstable) steady
state but ultimately lead the system to a steady limit cycle. Will this cycle be chosen
by the system for initial conditions that are significantly different from those that
Fig. 10.2
Fig. 10.3
10.1 Brusselator Model Equations
87
confirm this observation, run the model for two initial conditions close to the
ones that yield steady state, for example X(t ¼ 0) ¼ 1, and X(t ¼ 0) ¼ 0.8, with
Y(t ¼ 0) ¼ 2.5 in each of the two cases. Figure 10.2 shows the results plotted in the
same graph, and in Fig. 10.3 we show the phase diagrams for these two model runs.
Small changes in the initial conditions lead away from the (unstable) steady
state but ultimately lead the system to a steady limit cycle. Will this cycle be chosen
by the system for initial conditions that are significantly different from those that
Fig. 10.2
Fig. 10.3
10.1 Brusselator Model Equations
87