

In our model, this stock represents the number of fish of the species we are studying
that populate the pond. If we assume that the pond is one square kilometer large, the
value of the state variable FISH is also its density, which will be updated and stored
in the computer’s memory at every step of time (DT) throughout the duration of the
model. The fish population is a stock, something that can be contained and
conserved in the reservoir; density is not a stock, it is not conserved. Nonetheless,
both of these variables are state variables. So, because we are studying a species of
fish in a specific area (one square kilometer), the population size and density are
represented by the same rectangle.
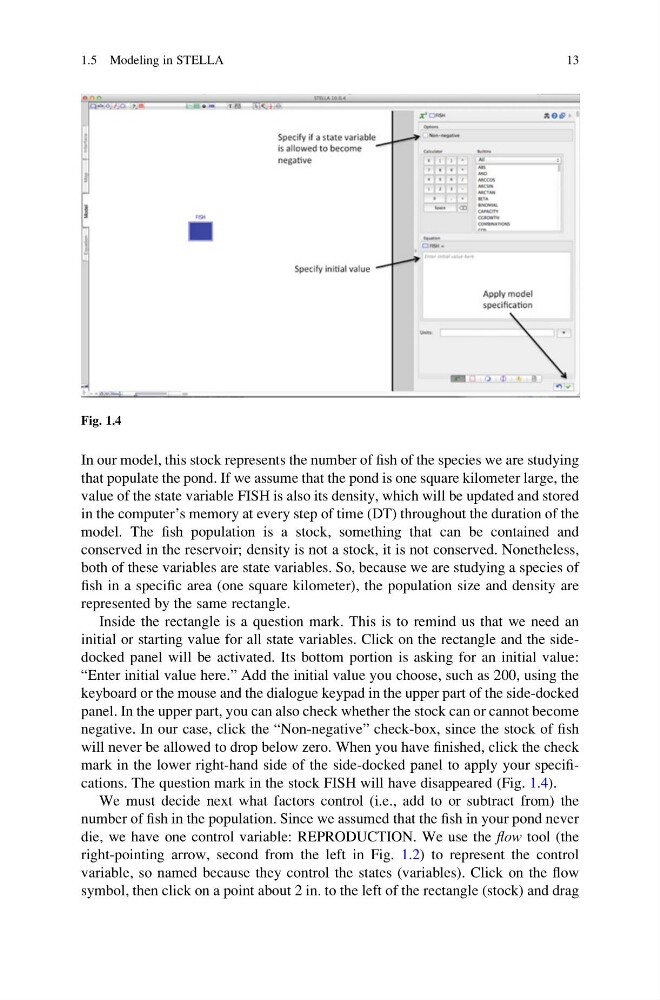
Inside the rectangle is a question mark. This is to remind us that we need an
initial or starting value for all state variables. Click on the rectangle and the sidedocked panel will be activated. Its bottom portion is asking for an initial value:
“Enter initial value here.” Add the initial value you choose, such as 200, using the
keyboard or the mouse and the dialogue keypad in the upper part of the side-docked
panel. In the upper part, you can also check whether the stock can or cannot become
negative. In our case, click the “Non-negative” check-box, since the stock of fish
will never be allowed to drop below zero. When you have finished, click the check
mark in the lower right-hand side of the side-docked panel to apply your specifications. The question mark in the stock FISH will have disappeared (Fig. 1.4).
We must decide next what factors control (i.e., add to or subtract from) the
number of fish in the population. Since we assumed that the fish in your pond never
die, we have one control variable: REPRODUCTION. We use the flow tool (the
right-pointing arrow, second from the left in Fig. 1.2) to represent the control
variable, so named because they control the states (variables). Click on the flow
symbol, then click on a point about 2 in. to the left of the rectangle (stock) and drag
Fig. 1.4
1.5 Modeling in STELLA
13
that populate the pond. If we assume that the pond is one square kilometer large, the
value of the state variable FISH is also its density, which will be updated and stored
in the computer’s memory at every step of time (DT) throughout the duration of the
model. The fish population is a stock, something that can be contained and
conserved in the reservoir; density is not a stock, it is not conserved. Nonetheless,
both of these variables are state variables. So, because we are studying a species of
fish in a specific area (one square kilometer), the population size and density are
represented by the same rectangle.
Inside the rectangle is a question mark. This is to remind us that we need an
initial or starting value for all state variables. Click on the rectangle and the sidedocked panel will be activated. Its bottom portion is asking for an initial value:
“Enter initial value here.” Add the initial value you choose, such as 200, using the
keyboard or the mouse and the dialogue keypad in the upper part of the side-docked
panel. In the upper part, you can also check whether the stock can or cannot become
negative. In our case, click the “Non-negative” check-box, since the stock of fish
will never be allowed to drop below zero. When you have finished, click the check
mark in the lower right-hand side of the side-docked panel to apply your specifications. The question mark in the stock FISH will have disappeared (Fig. 1.4).
We must decide next what factors control (i.e., add to or subtract from) the
number of fish in the population. Since we assumed that the fish in your pond never
die, we have one control variable: REPRODUCTION. We use the flow tool (the
right-pointing arrow, second from the left in Fig. 1.2) to represent the control
variable, so named because they control the states (variables). Click on the flow
symbol, then click on a point about 2 in. to the left of the rectangle (stock) and drag
Fig. 1.4
1.5 Modeling in STELLA
13