

the arrow to POPULATION, until the stock becomes dashed, and release. Label the
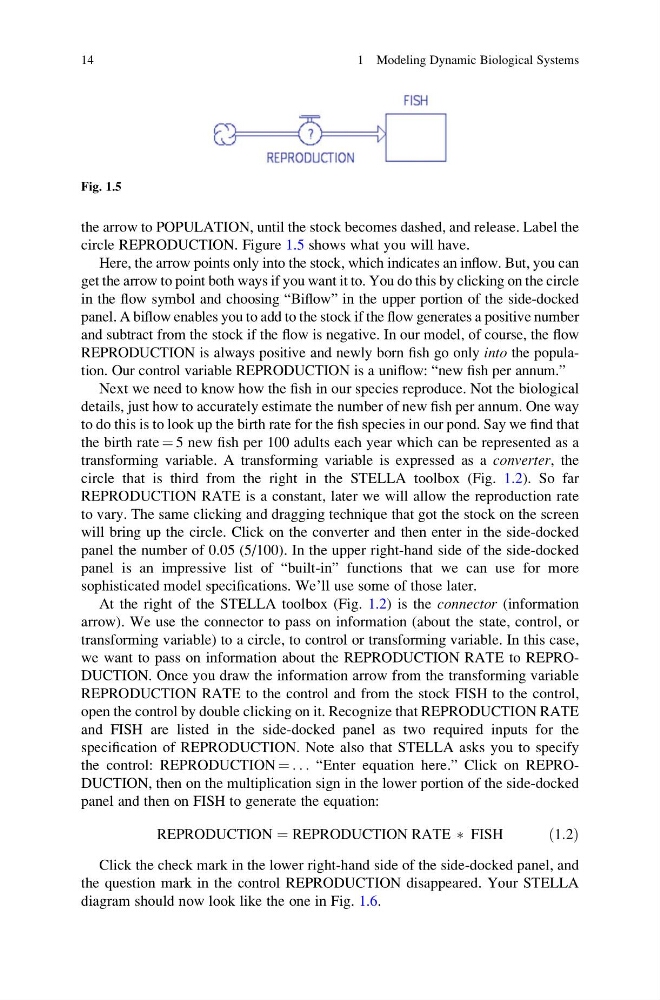
circle REPRODUCTION. Figure 1.5 shows what you will have.
Here, the arrow points only into the stock, which indicates an inflow. But, you can
get the arrow to point both ways if you want it to. You do this by clicking on the circle
in the flow symbol and choosing “Biflow” in the upper portion of the side-docked
panel. A biflow enables you to add to the stock if the flow generates a positive number
and subtract from the stock if the flow is negative. In our model, of course, the flow
REPRODUCTION is always positive and newly born fish go only into the population. Our control variable REPRODUCTION is a uniflow: “new fish per annum.”
Next we need to know how the fish in our species reproduce. Not the biological
details, just how to accurately estimate the number of new fish per annum. One way
to do this is to look up the birth rate for the fish species in our pond. Say we find that
the birth rate ¼ 5 new fish per 100 adults each year which can be represented as a
transforming variable. A transforming variable is expressed as a converter, the
circle that is third from the right in the STELLA toolbox (Fig. 1.2). So far
REPRODUCTION RATE is a constant, later we will allow the reproduction rate
to vary. The same clicking and dragging technique that got the stock on the screen
will bring up the circle. Click on the converter and then enter in the side-docked
panel the number of 0.05 (5/100). In the upper right-hand side of the side-docked
panel is an impressive list of “built-in” functions that we can use for more
sophisticated model specifications. We’ll use some of those later.
At the right of the STELLA toolbox (Fig. 1.2) is the connector (information
arrow). We use the connector to pass on information (about the state, control, or
transforming variable) to a circle, to control or transforming variable. In this case,
we want to pass on information about the REPRODUCTION RATE to REPRODUCTION. Once you draw the information arrow from the transforming variable
REPRODUCTION RATE to the control and from the stock FISH to the control,
open the control by double clicking on it. Recognize that REPRODUCTION RATE
and FISH are listed in the side-docked panel as two required inputs for the
specification of REPRODUCTION. Note also that STELLA asks you to specify
the control: REPRODUCTION ¼ . . . “Enter equation here.” Click on REPRODUCTION, then on the multiplication sign in the lower portion of the side-docked
panel and then on FISH to generate the equation:
REPRODUCTION ¼ REPRODUCTION RATE Ã FISH
ð1:2Þ
Click the check mark in the lower right-hand side of the side-docked panel, and
the question mark in the control REPRODUCTION disappeared. Your STELLA
diagram should now look like the one in Fig. 1.6.
Fig. 1.5
14
1 Modeling Dynamic Biological Systems
circle REPRODUCTION. Figure 1.5 shows what you will have.
Here, the arrow points only into the stock, which indicates an inflow. But, you can
get the arrow to point both ways if you want it to. You do this by clicking on the circle
in the flow symbol and choosing “Biflow” in the upper portion of the side-docked
panel. A biflow enables you to add to the stock if the flow generates a positive number
and subtract from the stock if the flow is negative. In our model, of course, the flow
REPRODUCTION is always positive and newly born fish go only into the population. Our control variable REPRODUCTION is a uniflow: “new fish per annum.”
Next we need to know how the fish in our species reproduce. Not the biological
details, just how to accurately estimate the number of new fish per annum. One way
to do this is to look up the birth rate for the fish species in our pond. Say we find that
the birth rate ¼ 5 new fish per 100 adults each year which can be represented as a
transforming variable. A transforming variable is expressed as a converter, the
circle that is third from the right in the STELLA toolbox (Fig. 1.2). So far
REPRODUCTION RATE is a constant, later we will allow the reproduction rate
to vary. The same clicking and dragging technique that got the stock on the screen
will bring up the circle. Click on the converter and then enter in the side-docked
panel the number of 0.05 (5/100). In the upper right-hand side of the side-docked
panel is an impressive list of “built-in” functions that we can use for more
sophisticated model specifications. We’ll use some of those later.
At the right of the STELLA toolbox (Fig. 1.2) is the connector (information
arrow). We use the connector to pass on information (about the state, control, or
transforming variable) to a circle, to control or transforming variable. In this case,
we want to pass on information about the REPRODUCTION RATE to REPRODUCTION. Once you draw the information arrow from the transforming variable
REPRODUCTION RATE to the control and from the stock FISH to the control,
open the control by double clicking on it. Recognize that REPRODUCTION RATE
and FISH are listed in the side-docked panel as two required inputs for the
specification of REPRODUCTION. Note also that STELLA asks you to specify
the control: REPRODUCTION ¼ . . . “Enter equation here.” Click on REPRODUCTION, then on the multiplication sign in the lower portion of the side-docked
panel and then on FISH to generate the equation:
REPRODUCTION ¼ REPRODUCTION RATE Ã FISH
ð1:2Þ
Click the check mark in the lower right-hand side of the side-docked panel, and
the question mark in the control REPRODUCTION disappeared. Your STELLA
diagram should now look like the one in Fig. 1.6.
Fig. 1.5
14
1 Modeling Dynamic Biological Systems