

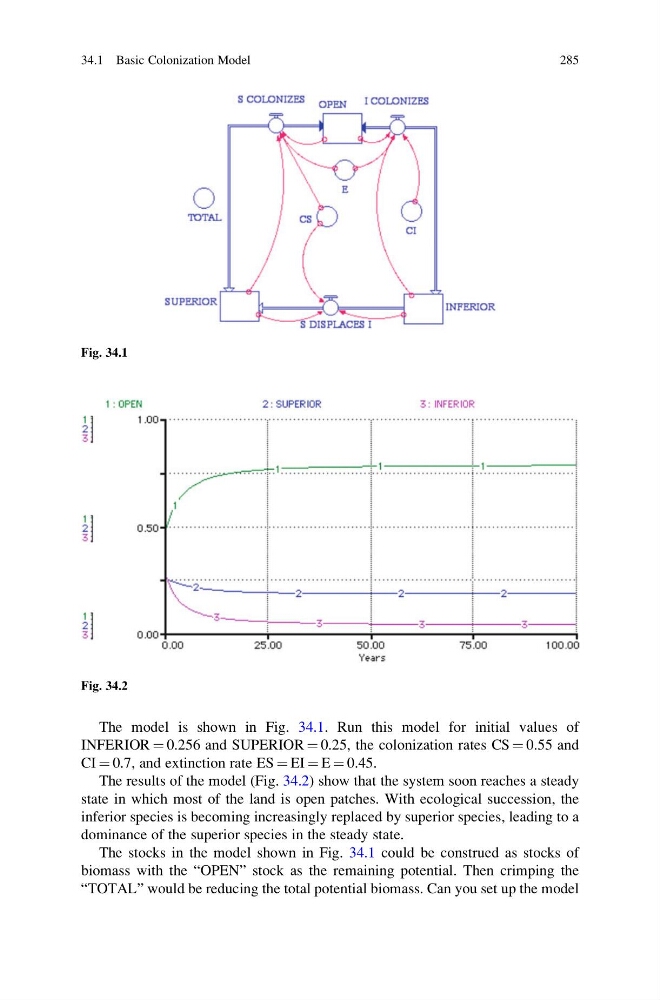
The model is shown in Fig. 34.1. Run this model for initial values of
INFERIOR ¼ 0.256 and SUPERIOR ¼ 0.25, the colonization rates CS ¼ 0.55 and
CI ¼ 0.7, and extinction rate ES ¼ EI ¼ E ¼ 0.45.
The results of the model (Fig. 34.2) show that the system soon reaches a steady
state in which most of the land is open patches. With ecological succession, the
inferior species is becoming increasingly replaced by superior species, leading to a
dominance of the superior species in the steady state.
The stocks in the model shown in Fig. 34.1 could be construed as stocks of
biomass with the “OPEN” stock as the remaining potential. Then crimping the
“TOTAL” would be reducing the total potential biomass. Can you set up the model
Fig. 34.1
Fig. 34.2
34.1 Basic Colonization Model
285
INFERIOR ¼ 0.256 and SUPERIOR ¼ 0.25, the colonization rates CS ¼ 0.55 and
CI ¼ 0.7, and extinction rate ES ¼ EI ¼ E ¼ 0.45.
The results of the model (Fig. 34.2) show that the system soon reaches a steady
state in which most of the land is open patches. With ecological succession, the
inferior species is becoming increasingly replaced by superior species, leading to a
dominance of the superior species in the steady state.
The stocks in the model shown in Fig. 34.1 could be construed as stocks of
biomass with the “OPEN” stock as the remaining potential. Then crimping the
“TOTAL” would be reducing the total potential biomass. Can you set up the model
Fig. 34.1
Fig. 34.2
34.1 Basic Colonization Model
285