

to investigate the implications of habitat loss for the colonization process? One way
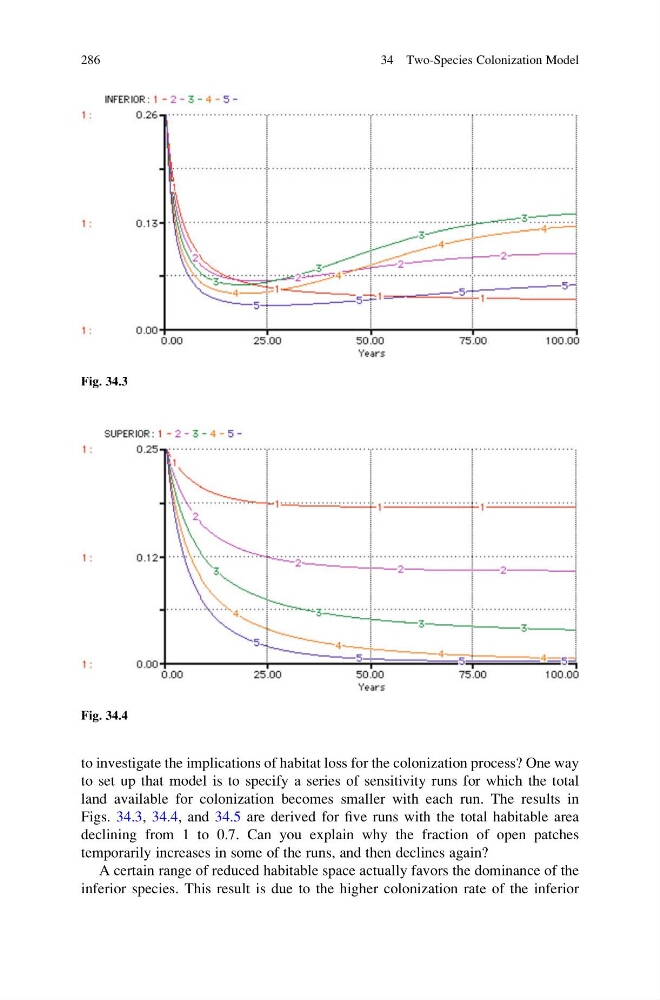
to set up that model is to specify a series of sensitivity runs for which the total
land available for colonization becomes smaller with each run. The results in
Figs. 34.3, 34.4, and 34.5 are derived for five runs with the total habitable area
declining from 1 to 0.7. Can you explain why the fraction of open patches
temporarily increases in some of the runs, and then declines again?
A certain range of reduced habitable space actually favors the dominance of the
inferior species. This result is due to the higher colonization rate of the inferior
Fig. 34.3
Fig. 34.4
286
34 Two-Species Colonization Model
to set up that model is to specify a series of sensitivity runs for which the total
land available for colonization becomes smaller with each run. The results in
Figs. 34.3, 34.4, and 34.5 are derived for five runs with the total habitable area
declining from 1 to 0.7. Can you explain why the fraction of open patches
temporarily increases in some of the runs, and then declines again?
A certain range of reduced habitable space actually favors the dominance of the
inferior species. This result is due to the higher colonization rate of the inferior
Fig. 34.3
Fig. 34.4
286
34 Two-Species Colonization Model