

conditions for the host and parasitoid, to their lock in a limit cycle, to chaos. Chaotic
system behavior is discussed in more detail in Part VII of the book.
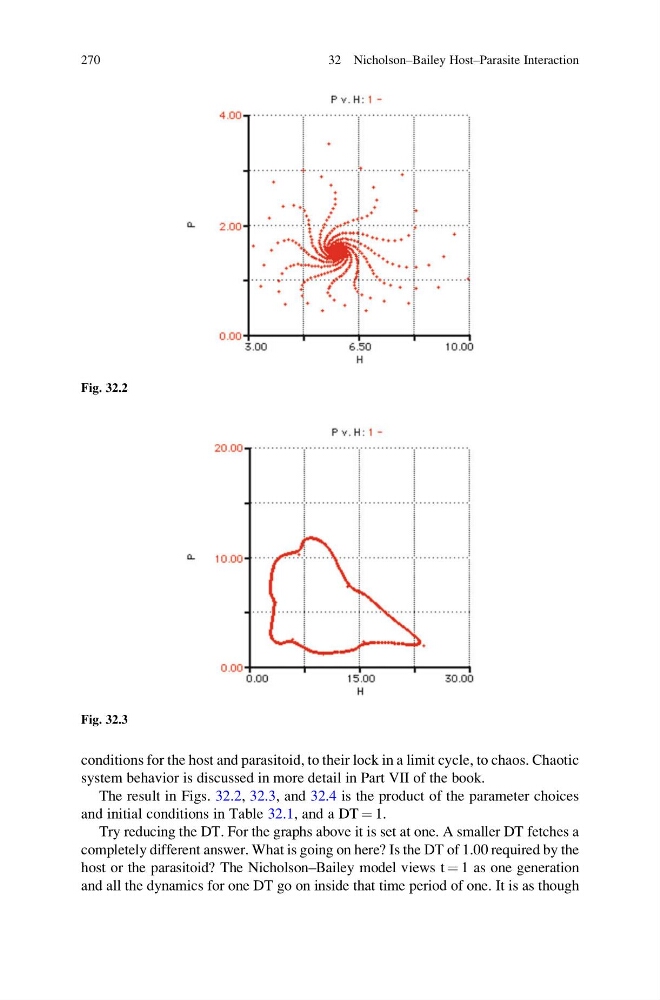
The result in Figs. 32.2, 32.3, and 32.4 is the product of the parameter choices
and initial conditions in Table 32.1, and a DT ¼ 1.
Try reducing the DT. For the graphs above it is set at one. A smaller DT fetches a
completely different answer. What is going on here? Is the DT of 1.00 required by the
host or the parasitoid? The Nicholson–Bailey model views t ¼ 1 as one generation
and all the dynamics for one DT go on inside that time period of one. It is as though
Fig. 32.3
Fig. 32.2
270
32 Nicholson–Bailey Host–Parasite Interaction
system behavior is discussed in more detail in Part VII of the book.
The result in Figs. 32.2, 32.3, and 32.4 is the product of the parameter choices
and initial conditions in Table 32.1, and a DT ¼ 1.
Try reducing the DT. For the graphs above it is set at one. A smaller DT fetches a
completely different answer. What is going on here? Is the DT of 1.00 required by the
host or the parasitoid? The Nicholson–Bailey model views t ¼ 1 as one generation
and all the dynamics for one DT go on inside that time period of one. It is as though
Fig. 32.3
Fig. 32.2
270
32 Nicholson–Bailey Host–Parasite Interaction