

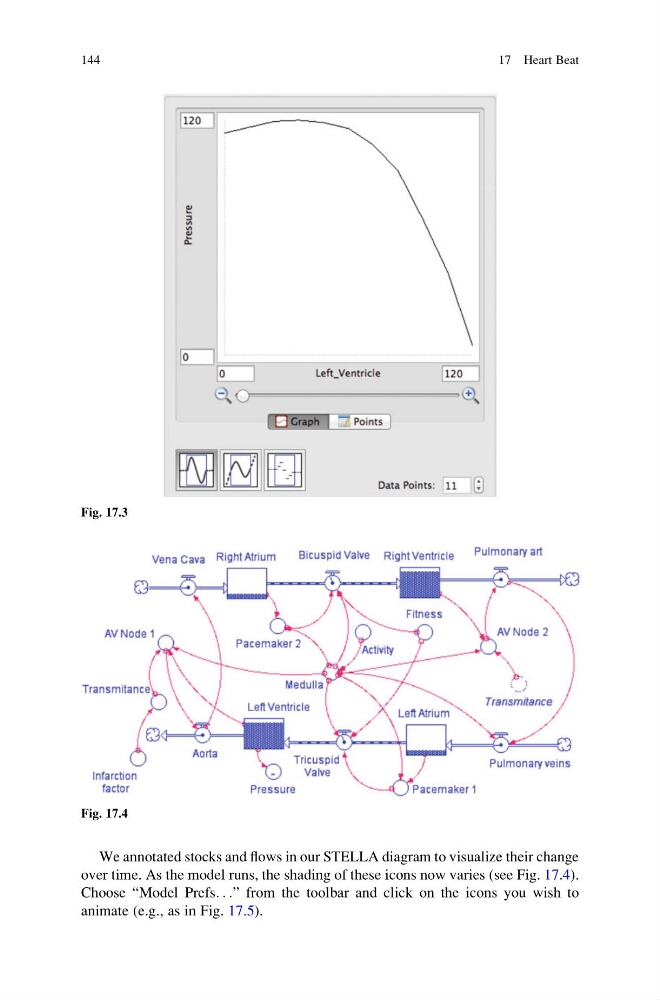
We annotated stocks and flows in our STELLA diagram to visualize their change
over time. As the model runs, the shading of these icons now varies (see Fig. 17.4).
Choose “Model Prefs. . .” from the toolbar and click on the icons you wish to
animate (e.g., as in Fig. 17.5).
Fig. 17.3
Fig. 17.4
144
17 Heart Beat
over time. As the model runs, the shading of these icons now varies (see Fig. 17.4).
Choose “Model Prefs. . .” from the toolbar and click on the icons you wish to
animate (e.g., as in Fig. 17.5).
Fig. 17.3
Fig. 17.4
144
17 Heart Beat