

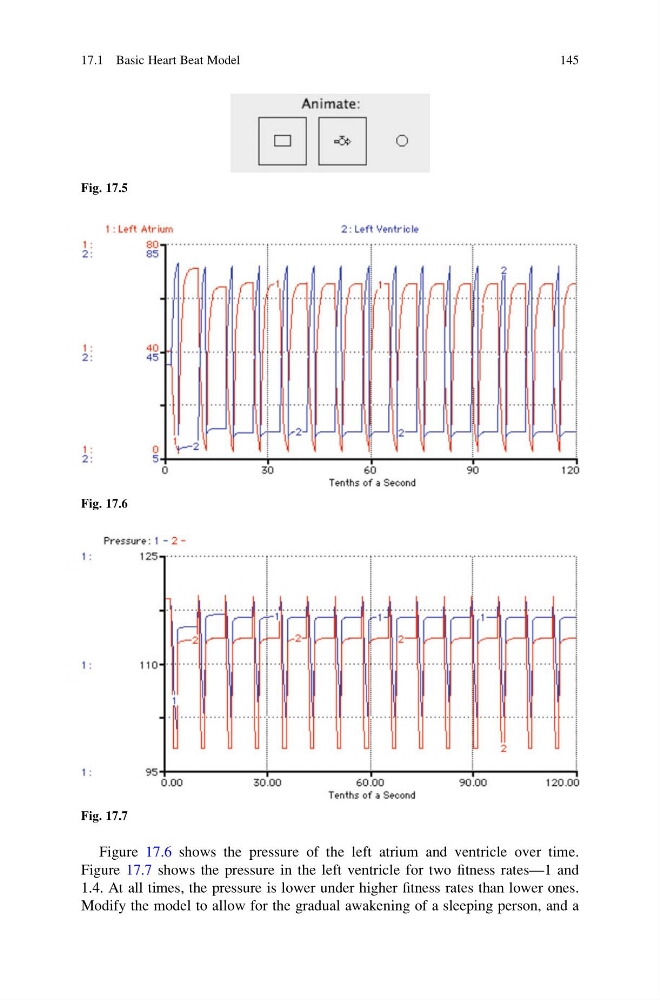
Figure 17.6 shows the pressure of the left atrium and ventricle over time.
Figure 17.7 shows the pressure in the left ventricle for two fitness rates—1 and
1.4. At all times, the pressure is lower under higher fitness rates than lower ones.
Modify the model to allow for the gradual awakening of a sleeping person, and a
Fig. 17.5
Fig. 17.6
Fig. 17.7
17.1 Basic Heart Beat Model
145
Figure 17.7 shows the pressure in the left ventricle for two fitness rates—1 and
1.4. At all times, the pressure is lower under higher fitness rates than lower ones.
Modify the model to allow for the gradual awakening of a sleeping person, and a
Fig. 17.5
Fig. 17.6
Fig. 17.7
17.1 Basic Heart Beat Model
145