

each of the four chambers of the heart. At the core of the model are two pacemakers,
each sending a Pulse that “pumps” the blood causing a flow from one chamber to
the next:
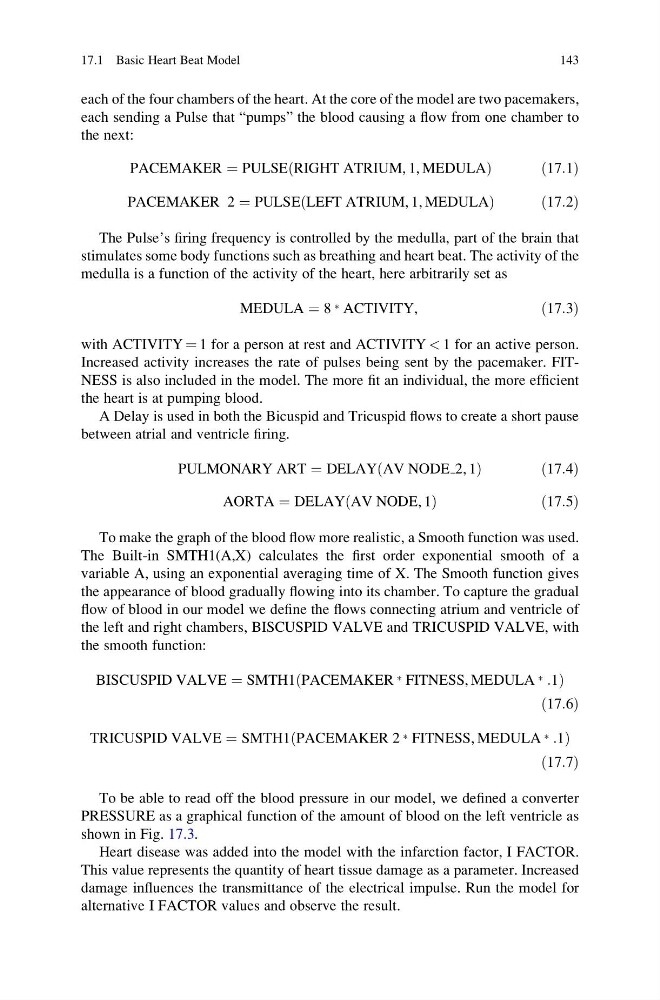
PACEMAKER ¼ PULSE RIGHT ATRIUM, 1, MEDULA
ð
Þ
ð 17:1Þ
PACEMAKER 2 ¼ PULSE LEFT ATRIUM, 1, MEDULA
ð
Þ
ð 17:2Þ
The Pulse’s firing frequency is controlled by the medulla, part of the brain that
stimulates some body functions such as breathing and heart beat. The activity of the
medulla is a function of the activity of the heart, here arbitrarily set as
MEDULA ¼ 8 Ã ACTIVITY,
ð17:3Þ
with ACTIVITY ¼ 1 for a person at rest and ACTIVITY < 1 for an active person.
Increased activity increases the rate of pulses being sent by the pacemaker. FITNESS is also included in the model. The more fit an individual, the more efficient
the heart is at pumping blood.
A Delay is used in both the Bicuspid and Tricuspid flows to create a short pause
between atrial and ventricle firing.
PULMONARY ART ¼ DELAY AV NODE 2, 1
ð
Þ
ð 17:4Þ
AORTA ¼ DELAY AV NODE, 1
ð
Þ
ð 17:5Þ
To make the graph of the blood flow more realistic, a Smooth function was used.
The Built-in SMTH1(A,X) calculates the first order exponential smooth of a
variable A, using an exponential averaging time of X. The Smooth function gives
the appearance of blood gradually flowing into its chamber. To capture the gradual
flow of blood in our model we define the flows connecting atrium and ventricle of
the left and right chambers, BISCUSPID VALVE and TRICUSPID VALVE, with
the smooth function:
BISCUSPID VALVE ¼ SMTH1 PACEMAKER Ã FITNESS, MEDULA Ã :1
ð
Þ
ð17:6Þ
TRICUSPID VALVE ¼ SMTH1 PACEMAKER 2 Ã FITNESS, MEDULA Ã :1
ð
Þ
ð17:7Þ
To be able to read off the blood pressure in our model, we defined a converter
PRESSURE as a graphical function of the amount of blood on the left ventricle as
shown in Fig. 17.3.
Heart disease was added into the model with the infarction factor, I FACTOR.
This value represents the quantity of heart tissue damage as a parameter. Increased
damage influences the transmittance of the electrical impulse. Run the model for
alternative I FACTOR values and observe the result.
17.1 Basic Heart Beat Model
143
each sending a Pulse that “pumps” the blood causing a flow from one chamber to
the next:
PACEMAKER ¼ PULSE RIGHT ATRIUM, 1, MEDULA
ð
Þ
ð 17:1Þ
PACEMAKER 2 ¼ PULSE LEFT ATRIUM, 1, MEDULA
ð
Þ
ð 17:2Þ
The Pulse’s firing frequency is controlled by the medulla, part of the brain that
stimulates some body functions such as breathing and heart beat. The activity of the
medulla is a function of the activity of the heart, here arbitrarily set as
MEDULA ¼ 8 Ã ACTIVITY,
ð17:3Þ
with ACTIVITY ¼ 1 for a person at rest and ACTIVITY < 1 for an active person.
Increased activity increases the rate of pulses being sent by the pacemaker. FITNESS is also included in the model. The more fit an individual, the more efficient
the heart is at pumping blood.
A Delay is used in both the Bicuspid and Tricuspid flows to create a short pause
between atrial and ventricle firing.
PULMONARY ART ¼ DELAY AV NODE 2, 1
ð
Þ
ð 17:4Þ
AORTA ¼ DELAY AV NODE, 1
ð
Þ
ð 17:5Þ
To make the graph of the blood flow more realistic, a Smooth function was used.
The Built-in SMTH1(A,X) calculates the first order exponential smooth of a
variable A, using an exponential averaging time of X. The Smooth function gives
the appearance of blood gradually flowing into its chamber. To capture the gradual
flow of blood in our model we define the flows connecting atrium and ventricle of
the left and right chambers, BISCUSPID VALVE and TRICUSPID VALVE, with
the smooth function:
BISCUSPID VALVE ¼ SMTH1 PACEMAKER Ã FITNESS, MEDULA Ã :1
ð
Þ
ð17:6Þ
TRICUSPID VALVE ¼ SMTH1 PACEMAKER 2 Ã FITNESS, MEDULA Ã :1
ð
Þ
ð17:7Þ
To be able to read off the blood pressure in our model, we defined a converter
PRESSURE as a graphical function of the amount of blood on the left ventricle as
shown in Fig. 17.3.
Heart disease was added into the model with the infarction factor, I FACTOR.
This value represents the quantity of heart tissue damage as a parameter. Increased
damage influences the transmittance of the electrical impulse. Run the model for
alternative I FACTOR values and observe the result.
17.1 Basic Heart Beat Model
143