

13. Potential of Branching Processes as a Modeling Tool
209
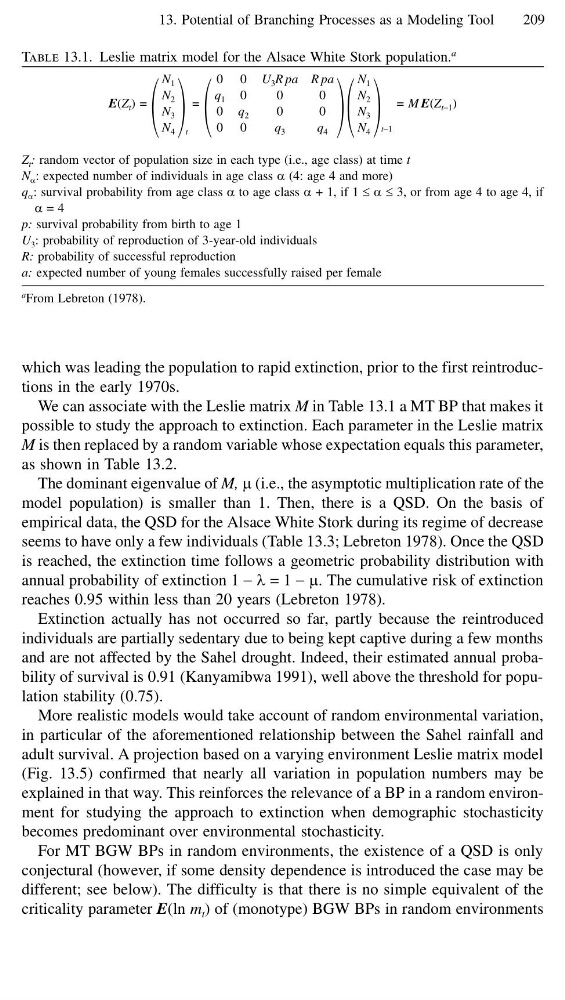
Table 13.1. Leslie matrix model for the Alsace White Stork population.
a
E(Z t ) =
N 1
N 2
N 3
N 4
t
=
0
q 1
0
0
0
0
q 2
0
U 3 R pa
0
0
q 3
R pa
0
0
q 4
N 1
N 2
N 3
N 4
t−1
= M E(Z t−1 )
Z t : random vector of population size in each type (i.e., age class) at time t
N α : expected number of individuals in age class α (4: age 4 and more)
q α : survival probability from age class α to age class α + 1, if 1 ≤ α ≤ 3, or from age 4 to age 4, if
α = 4
p: survival probability from birth to age 1
U 3 : probability of reproduction of 3-year-old individuals
R: probability of successful reproduction
a: expected number of young females successfully raised per female
a From Lebreton (1978).
which was leading the population to rapid extinction, prior to the first reintroductions in the early 1970s.
We can associate with the Leslie matrix M in Table 13.1 a MT BP that makes it
possible to study the approach to extinction. Each parameter in the Leslie matrix
M is then replaced by a random variable whose expectation equals this parameter,
as shown in Table 13.2.
The dominant eigenvalue of M, µ (i.e., the asymptotic multiplication rate of the
model population) is smaller than 1. Then, there is a QSD. On the basis of
empirical data, the QSD for the Alsace White Stork during its regime of decrease
seems to have only a few individuals (Table 13.3; Lebreton 1978). Once the QSD
is reached, the extinction time follows a geometric probability distribution with
annual probability of extinction 1 − λ = 1 − µ. The cumulative risk of extinction
reaches 0.95 within less than 20 years (Lebreton 1978).
Extinction actually has not occurred so far, partly because the reintroduced
individuals are partially sedentary due to being kept captive during a few months
and are not affected by the Sahel drought. Indeed, their estimated annual probability of survival is 0.91 (Kanyamibwa 1991), well above the threshold for population stability (0.75).
More realistic models would take account of random environmental variation,
in particular of the aforementioned relationship between the Sahel rainfall and
adult survival. A projection based on a varying environment Leslie matrix model
(Fig. 13.5) confirmed that nearly all variation in population numbers may be
explained in that way. This reinforces the relevance of a BP in a random environment for studying the approach to extinction when demographic stochasticity
becomes predominant over environmental stochasticity.
For MT BGW BPs in random environments, the existence of a QSD is only
conjectural (however, if some density dependence is introduced the case may be
different; see below). The difficulty is that there is no simple equivalent of the
criticality parameter E(ln m t ) of (monotype) BGW BPs in random environments
209
Table 13.1. Leslie matrix model for the Alsace White Stork population.
a
E(Z t ) =
N 1
N 2
N 3
N 4
t
=
0
q 1
0
0
0
0
q 2
0
U 3 R pa
0
0
q 3
R pa
0
0
q 4
N 1
N 2
N 3
N 4
t−1
= M E(Z t−1 )
Z t : random vector of population size in each type (i.e., age class) at time t
N α : expected number of individuals in age class α (4: age 4 and more)
q α : survival probability from age class α to age class α + 1, if 1 ≤ α ≤ 3, or from age 4 to age 4, if
α = 4
p: survival probability from birth to age 1
U 3 : probability of reproduction of 3-year-old individuals
R: probability of successful reproduction
a: expected number of young females successfully raised per female
a From Lebreton (1978).
which was leading the population to rapid extinction, prior to the first reintroductions in the early 1970s.
We can associate with the Leslie matrix M in Table 13.1 a MT BP that makes it
possible to study the approach to extinction. Each parameter in the Leslie matrix
M is then replaced by a random variable whose expectation equals this parameter,
as shown in Table 13.2.
The dominant eigenvalue of M, µ (i.e., the asymptotic multiplication rate of the
model population) is smaller than 1. Then, there is a QSD. On the basis of
empirical data, the QSD for the Alsace White Stork during its regime of decrease
seems to have only a few individuals (Table 13.3; Lebreton 1978). Once the QSD
is reached, the extinction time follows a geometric probability distribution with
annual probability of extinction 1 − λ = 1 − µ. The cumulative risk of extinction
reaches 0.95 within less than 20 years (Lebreton 1978).
Extinction actually has not occurred so far, partly because the reintroduced
individuals are partially sedentary due to being kept captive during a few months
and are not affected by the Sahel drought. Indeed, their estimated annual probability of survival is 0.91 (Kanyamibwa 1991), well above the threshold for population stability (0.75).
More realistic models would take account of random environmental variation,
in particular of the aforementioned relationship between the Sahel rainfall and
adult survival. A projection based on a varying environment Leslie matrix model
(Fig. 13.5) confirmed that nearly all variation in population numbers may be
explained in that way. This reinforces the relevance of a BP in a random environment for studying the approach to extinction when demographic stochasticity
becomes predominant over environmental stochasticity.
For MT BGW BPs in random environments, the existence of a QSD is only
conjectural (however, if some density dependence is introduced the case may be
different; see below). The difficulty is that there is no simple equivalent of the
criticality parameter E(ln m t ) of (monotype) BGW BPs in random environments