

102
Barbara L. Taylor and Paul R. Wade
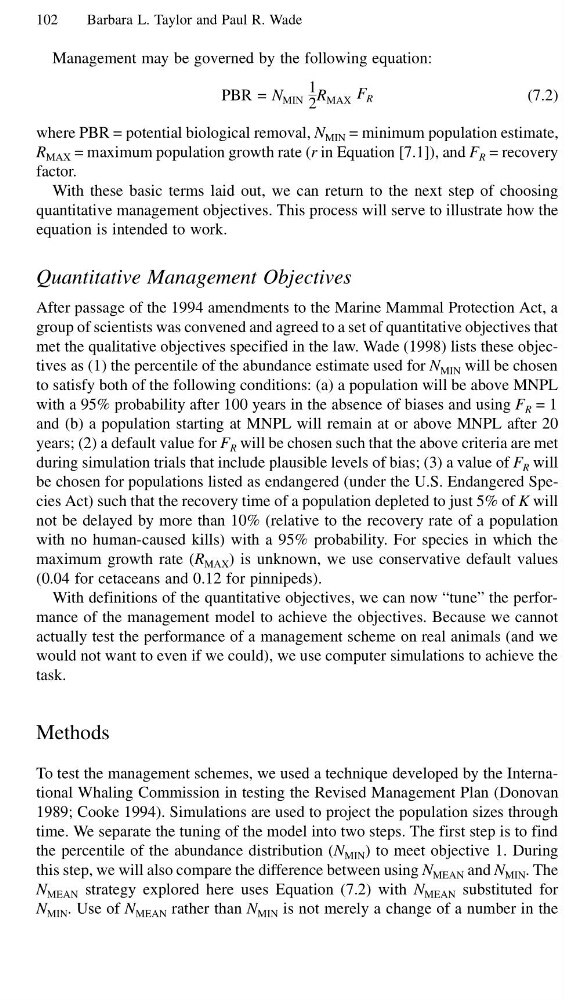
Management may be governed by the following equation:
PBR = N MIN
1
2
R MAX F R
(7.2)
where PBR = potential biological removal, N MIN = minimum population estimate,
R MAX = maximum population growth rate (r in Equation [7.1]), and F R = recovery
factor.
With these basic terms laid out, we can return to the next step of choosing
quantitative management objectives. This process will serve to illustrate how the
equation is intended to work.
Quantitative Management Objectives
After passage of the 1994 amendments to the Marine Mammal Protection Act, a
group of scientists was convened and agreed to a set of quantitative objectives that
met the qualitative objectives specified in the law. Wade (1998) lists these objectives as (1) the percentile of the abundance estimate used for N MIN will be chosen
to satisfy both of the following conditions: (a) a population will be above MNPL
with a 95% probability after 100 years in the absence of biases and using F R = 1
and (b) a population starting at MNPL will remain at or above MNPL after 20
years; (2) a default value for F R will be chosen such that the above criteria are met
during simulation trials that include plausible levels of bias; (3) a value of F R will
be chosen for populations listed as endangered (under the U.S. Endangered Species Act) such that the recovery time of a population depleted to just 5% of K will
not be delayed by more than 10% (relative to the recovery rate of a population
with no human-caused kills) with a 95% probability. For species in which the
maximum growth rate (R MAX ) is unknown, we use conservative default values
(0.04 for cetaceans and 0.12 for pinnipeds).
With definitions of the quantitative objectives, we can now “tune” the performance of the management model to achieve the objectives. Because we cannot
actually test the performance of a management scheme on real animals (and we
would not want to even if we could), we use computer simulations to achieve the
task.
Methods
To test the management schemes, we used a technique developed by the International Whaling Commission in testing the Revised Management Plan (Donovan
1989; Cooke 1994). Simulations are used to project the population sizes through
time. We separate the tuning of the model into two steps. The first step is to find
the percentile of the abundance distribution (N MIN ) to meet objective 1. During
this step, we will also compare the difference between using N MEAN and N MIN . The
N MEAN strategy explored here uses Equation (7.2) with N MEAN substituted for
N MIN . Use of N MEAN rather than N MIN is not merely a change of a number in the
Barbara L. Taylor and Paul R. Wade
Management may be governed by the following equation:
PBR = N MIN
1
2
R MAX F R
(7.2)
where PBR = potential biological removal, N MIN = minimum population estimate,
R MAX = maximum population growth rate (r in Equation [7.1]), and F R = recovery
factor.
With these basic terms laid out, we can return to the next step of choosing
quantitative management objectives. This process will serve to illustrate how the
equation is intended to work.
Quantitative Management Objectives
After passage of the 1994 amendments to the Marine Mammal Protection Act, a
group of scientists was convened and agreed to a set of quantitative objectives that
met the qualitative objectives specified in the law. Wade (1998) lists these objectives as (1) the percentile of the abundance estimate used for N MIN will be chosen
to satisfy both of the following conditions: (a) a population will be above MNPL
with a 95% probability after 100 years in the absence of biases and using F R = 1
and (b) a population starting at MNPL will remain at or above MNPL after 20
years; (2) a default value for F R will be chosen such that the above criteria are met
during simulation trials that include plausible levels of bias; (3) a value of F R will
be chosen for populations listed as endangered (under the U.S. Endangered Species Act) such that the recovery time of a population depleted to just 5% of K will
not be delayed by more than 10% (relative to the recovery rate of a population
with no human-caused kills) with a 95% probability. For species in which the
maximum growth rate (R MAX ) is unknown, we use conservative default values
(0.04 for cetaceans and 0.12 for pinnipeds).
With definitions of the quantitative objectives, we can now “tune” the performance of the management model to achieve the objectives. Because we cannot
actually test the performance of a management scheme on real animals (and we
would not want to even if we could), we use computer simulations to achieve the
task.
Methods
To test the management schemes, we used a technique developed by the International Whaling Commission in testing the Revised Management Plan (Donovan
1989; Cooke 1994). Simulations are used to project the population sizes through
time. We separate the tuning of the model into two steps. The first step is to find
the percentile of the abundance distribution (N MIN ) to meet objective 1. During
this step, we will also compare the difference between using N MEAN and N MIN . The
N MEAN strategy explored here uses Equation (7.2) with N MEAN substituted for
N MIN . Use of N MEAN rather than N MIN is not merely a change of a number in the