

7. “Best” Abundance Estimates and Best Management
99
Figure 7.2. Schematic of a linetransect survey. Squares indicate animals (50). Sighted animals are connected with perpendicular lines to the
survey trackline (12). Total abundance in the area is estimated from the
sighting data and would differ if the
survey was conducted again.
For any single survey, there is a single best estimate of abundance (N MEAN ) that
comes from the appropriate distribution with the probabilities shown. The “best”
estimate tells us nothing about the confidence we have in our estimate. Best
estimates for Beaked Whales will vary more than best estimates for Blue Whales.
For Blue Whales, the estimated population would usually be between 600 and
1,600. For Beaked Whales estimates are less certain. There is a good chance of
estimating abundance anywhere from 200 to 3,000.
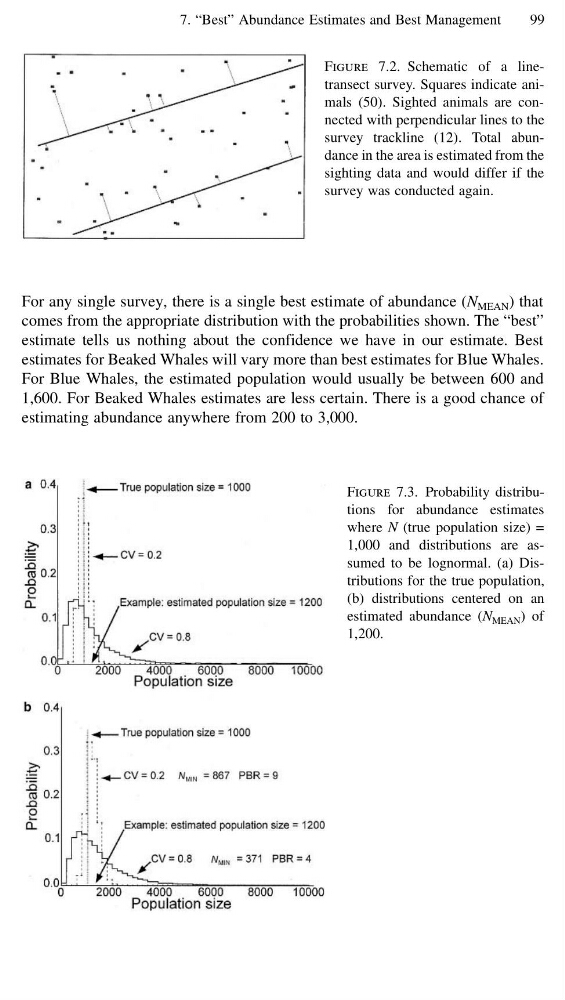
Figure 7.3. Probability distributions for abundance estimates
where N (true population size) =
1,000 and distributions are assumed to be lognormal. (a) Distributions for the true population,
(b) distributions centered on an
estimated abundance (N MEAN ) of
1,200.
99
Figure 7.2. Schematic of a linetransect survey. Squares indicate animals (50). Sighted animals are connected with perpendicular lines to the
survey trackline (12). Total abundance in the area is estimated from the
sighting data and would differ if the
survey was conducted again.
For any single survey, there is a single best estimate of abundance (N MEAN ) that
comes from the appropriate distribution with the probabilities shown. The “best”
estimate tells us nothing about the confidence we have in our estimate. Best
estimates for Beaked Whales will vary more than best estimates for Blue Whales.
For Blue Whales, the estimated population would usually be between 600 and
1,600. For Beaked Whales estimates are less certain. There is a good chance of
estimating abundance anywhere from 200 to 3,000.
Figure 7.3. Probability distributions for abundance estimates
where N (true population size) =
1,000 and distributions are assumed to be lognormal. (a) Distributions for the true population,
(b) distributions centered on an
estimated abundance (N MEAN ) of
1,200.