

98
Barbara L. Taylor and Paul R. Wade
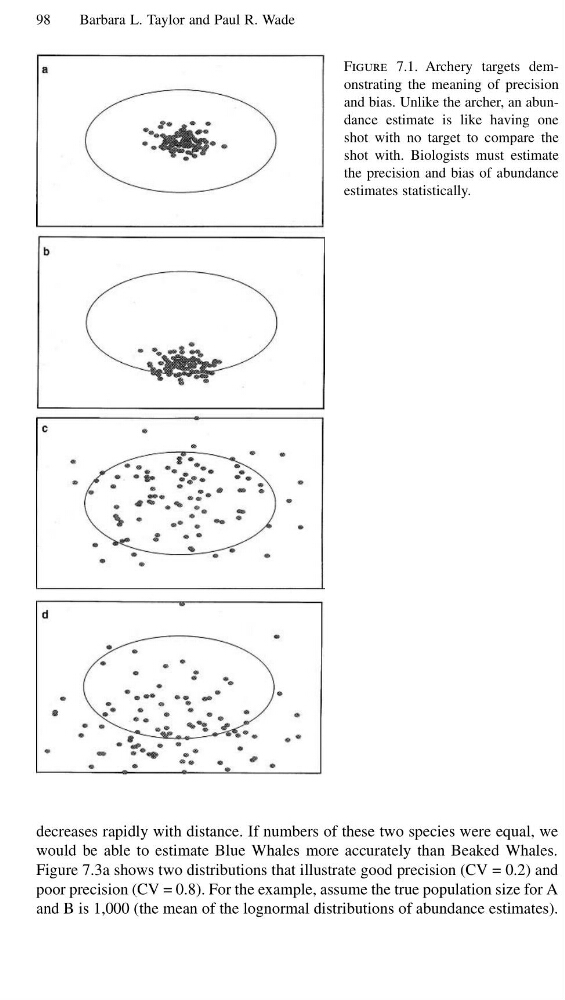
Figure 7.1. Archery targets demonstrating the meaning of precision
and bias. Unlike the archer, an abundance estimate is like having one
shot with no target to compare the
shot with. Biologists must estimate
the precision and bias of abundance
estimates statistically.
decreases rapidly with distance. If numbers of these two species were equal, we
would be able to estimate Blue Whales more accurately than Beaked Whales.
Figure 7.3a shows two distributions that illustrate good precision (CV = 0.2) and
poor precision (CV = 0.8). For the example, assume the true population size for A
and B is 1,000 (the mean of the lognormal distributions of abundance estimates).
Barbara L. Taylor and Paul R. Wade
Figure 7.1. Archery targets demonstrating the meaning of precision
and bias. Unlike the archer, an abundance estimate is like having one
shot with no target to compare the
shot with. Biologists must estimate
the precision and bias of abundance
estimates statistically.
decreases rapidly with distance. If numbers of these two species were equal, we
would be able to estimate Blue Whales more accurately than Beaked Whales.
Figure 7.3a shows two distributions that illustrate good precision (CV = 0.2) and
poor precision (CV = 0.8). For the example, assume the true population size for A
and B is 1,000 (the mean of the lognormal distributions of abundance estimates).