

6. Likelihood of Introducing Nonindigenous Organisms
93
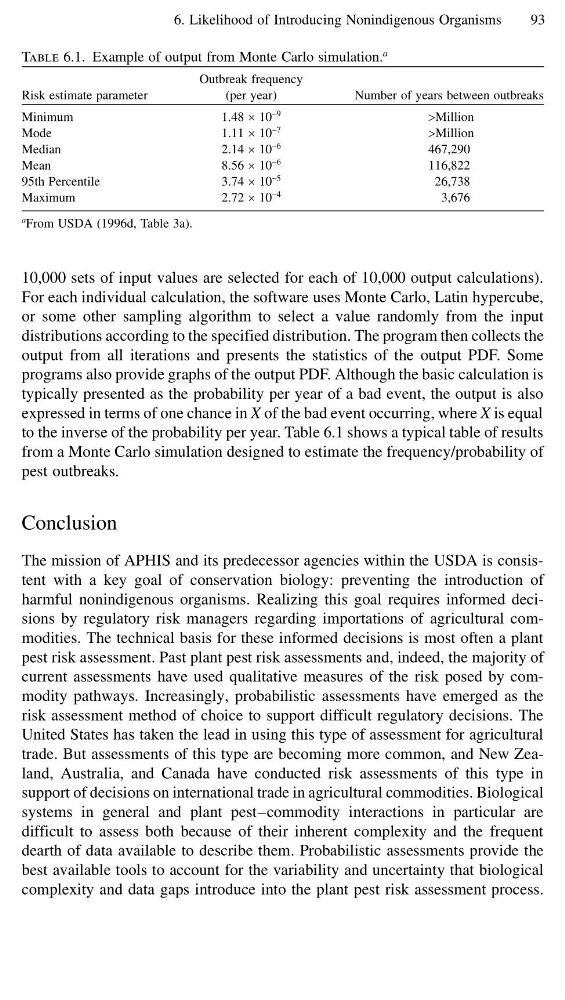
Table 6.1. Example of output from Monte Carlo simulation.
a
Risk estimate parameter
Outbreak frequency
(per year)
Number of years between outbreaks
Minimum
1.48 × 10
−9
>Million
Mode
1.11 × 10
−7
>Million
Median
2.14 × 10
−6
467,290
Mean
8.56 × 10
−6
116,822
95th Percentile
3.74 × 10
−5
26,738
Maximum
2.72 × 10
−4
3,676
a From USDA (1996d, Table 3a).
10,000 sets of input values are selected for each of 10,000 output calculations).
For each individual calculation, the software uses Monte Carlo, Latin hypercube,
or some other sampling algorithm to select a value randomly from the input
distributions according to the specified distribution. The program then collects the
output from all iterations and presents the statistics of the output PDF. Some
programs also provide graphs of the output PDF. Although the basic calculation is
typically presented as the probability per year of a bad event, the output is also
expressed in terms of one chance in X of the bad event occurring, where X is equal
to the inverse of the probability per year. Table 6.1 shows a typical table of results
from a Monte Carlo simulation designed to estimate the frequency/probability of
pest outbreaks.
Conclusion
The mission of APHIS and its predecessor agencies within the USDA is consistent with a key goal of conservation biology: preventing the introduction of
harmful nonindigenous organisms. Realizing this goal requires informed decisions by regulatory risk managers regarding importations of agricultural commodities. The technical basis for these informed decisions is most often a plant
pest risk assessment. Past plant pest risk assessments and, indeed, the majority of
current assessments have used qualitative measures of the risk posed by commodity pathways. Increasingly, probabilistic assessments have emerged as the
risk assessment method of choice to support difficult regulatory decisions. The
United States has taken the lead in using this type of assessment for agricultural
trade. But assessments of this type are becoming more common, and New Zealand, Australia, and Canada have conducted risk assessments of this type in
support of decisions on international trade in agricultural commodities. Biological
systems in general and plant pest–commodity interactions in particular are
difficult to assess both because of their inherent complexity and the frequent
dearth of data available to describe them. Probabilistic assessments provide the
best available tools to account for the variability and uncertainty that biological
complexity and data gaps introduce into the plant pest risk assessment process.
93
Table 6.1. Example of output from Monte Carlo simulation.
a
Risk estimate parameter
Outbreak frequency
(per year)
Number of years between outbreaks
Minimum
1.48 × 10
−9
>Million
Mode
1.11 × 10
−7
>Million
Median
2.14 × 10
−6
467,290
Mean
8.56 × 10
−6
116,822
95th Percentile
3.74 × 10
−5
26,738
Maximum
2.72 × 10
−4
3,676
a From USDA (1996d, Table 3a).
10,000 sets of input values are selected for each of 10,000 output calculations).
For each individual calculation, the software uses Monte Carlo, Latin hypercube,
or some other sampling algorithm to select a value randomly from the input
distributions according to the specified distribution. The program then collects the
output from all iterations and presents the statistics of the output PDF. Some
programs also provide graphs of the output PDF. Although the basic calculation is
typically presented as the probability per year of a bad event, the output is also
expressed in terms of one chance in X of the bad event occurring, where X is equal
to the inverse of the probability per year. Table 6.1 shows a typical table of results
from a Monte Carlo simulation designed to estimate the frequency/probability of
pest outbreaks.
Conclusion
The mission of APHIS and its predecessor agencies within the USDA is consistent with a key goal of conservation biology: preventing the introduction of
harmful nonindigenous organisms. Realizing this goal requires informed decisions by regulatory risk managers regarding importations of agricultural commodities. The technical basis for these informed decisions is most often a plant
pest risk assessment. Past plant pest risk assessments and, indeed, the majority of
current assessments have used qualitative measures of the risk posed by commodity pathways. Increasingly, probabilistic assessments have emerged as the
risk assessment method of choice to support difficult regulatory decisions. The
United States has taken the lead in using this type of assessment for agricultural
trade. But assessments of this type are becoming more common, and New Zealand, Australia, and Canada have conducted risk assessments of this type in
support of decisions on international trade in agricultural commodities. Biological
systems in general and plant pest–commodity interactions in particular are
difficult to assess both because of their inherent complexity and the frequent
dearth of data available to describe them. Probabilistic assessments provide the
best available tools to account for the variability and uncertainty that biological
complexity and data gaps introduce into the plant pest risk assessment process.